In the second fiscal quarter, Tilray Brands, Inc. (TLRY) reported a record net revenue of $194 million. This reflects an impressive surge of 34% compared to the same period in the previous year, primarily attributed to robust sales in their cannabis and beverage sector.
Despite nearing break-even profitability with an adjusted loss per share of zero, the company recorded a net loss of $2.70 million adjusted for the quarter at the bottom line.
Furthermore, the Adjusted EBITDA for the second quarter was reported at $10.10 million, in contrast to $11 million in the same quarter of the past year. This primarily stems from the HEXO advisory fee revenue of the previous year's quarter combined with timing differences recognizing synergies following recent acquisitions.
The gross profit margins experienced a slump in both the cannabis and beverage alcohol segments, dropping by 12 percentage points to 31% in the former and by 13 percentage points to 34% in the latter.
In light of the underwhelming bottom-line performance, potential investors might want to exercise caution with TLRY. Further scrutiny of its fundamental performance indicators could offer deeper insights into the company's financial health.
Unpacking Financial Performance of TLRY: Trends, Growth Rates and Market Signals from 2021 to 2023
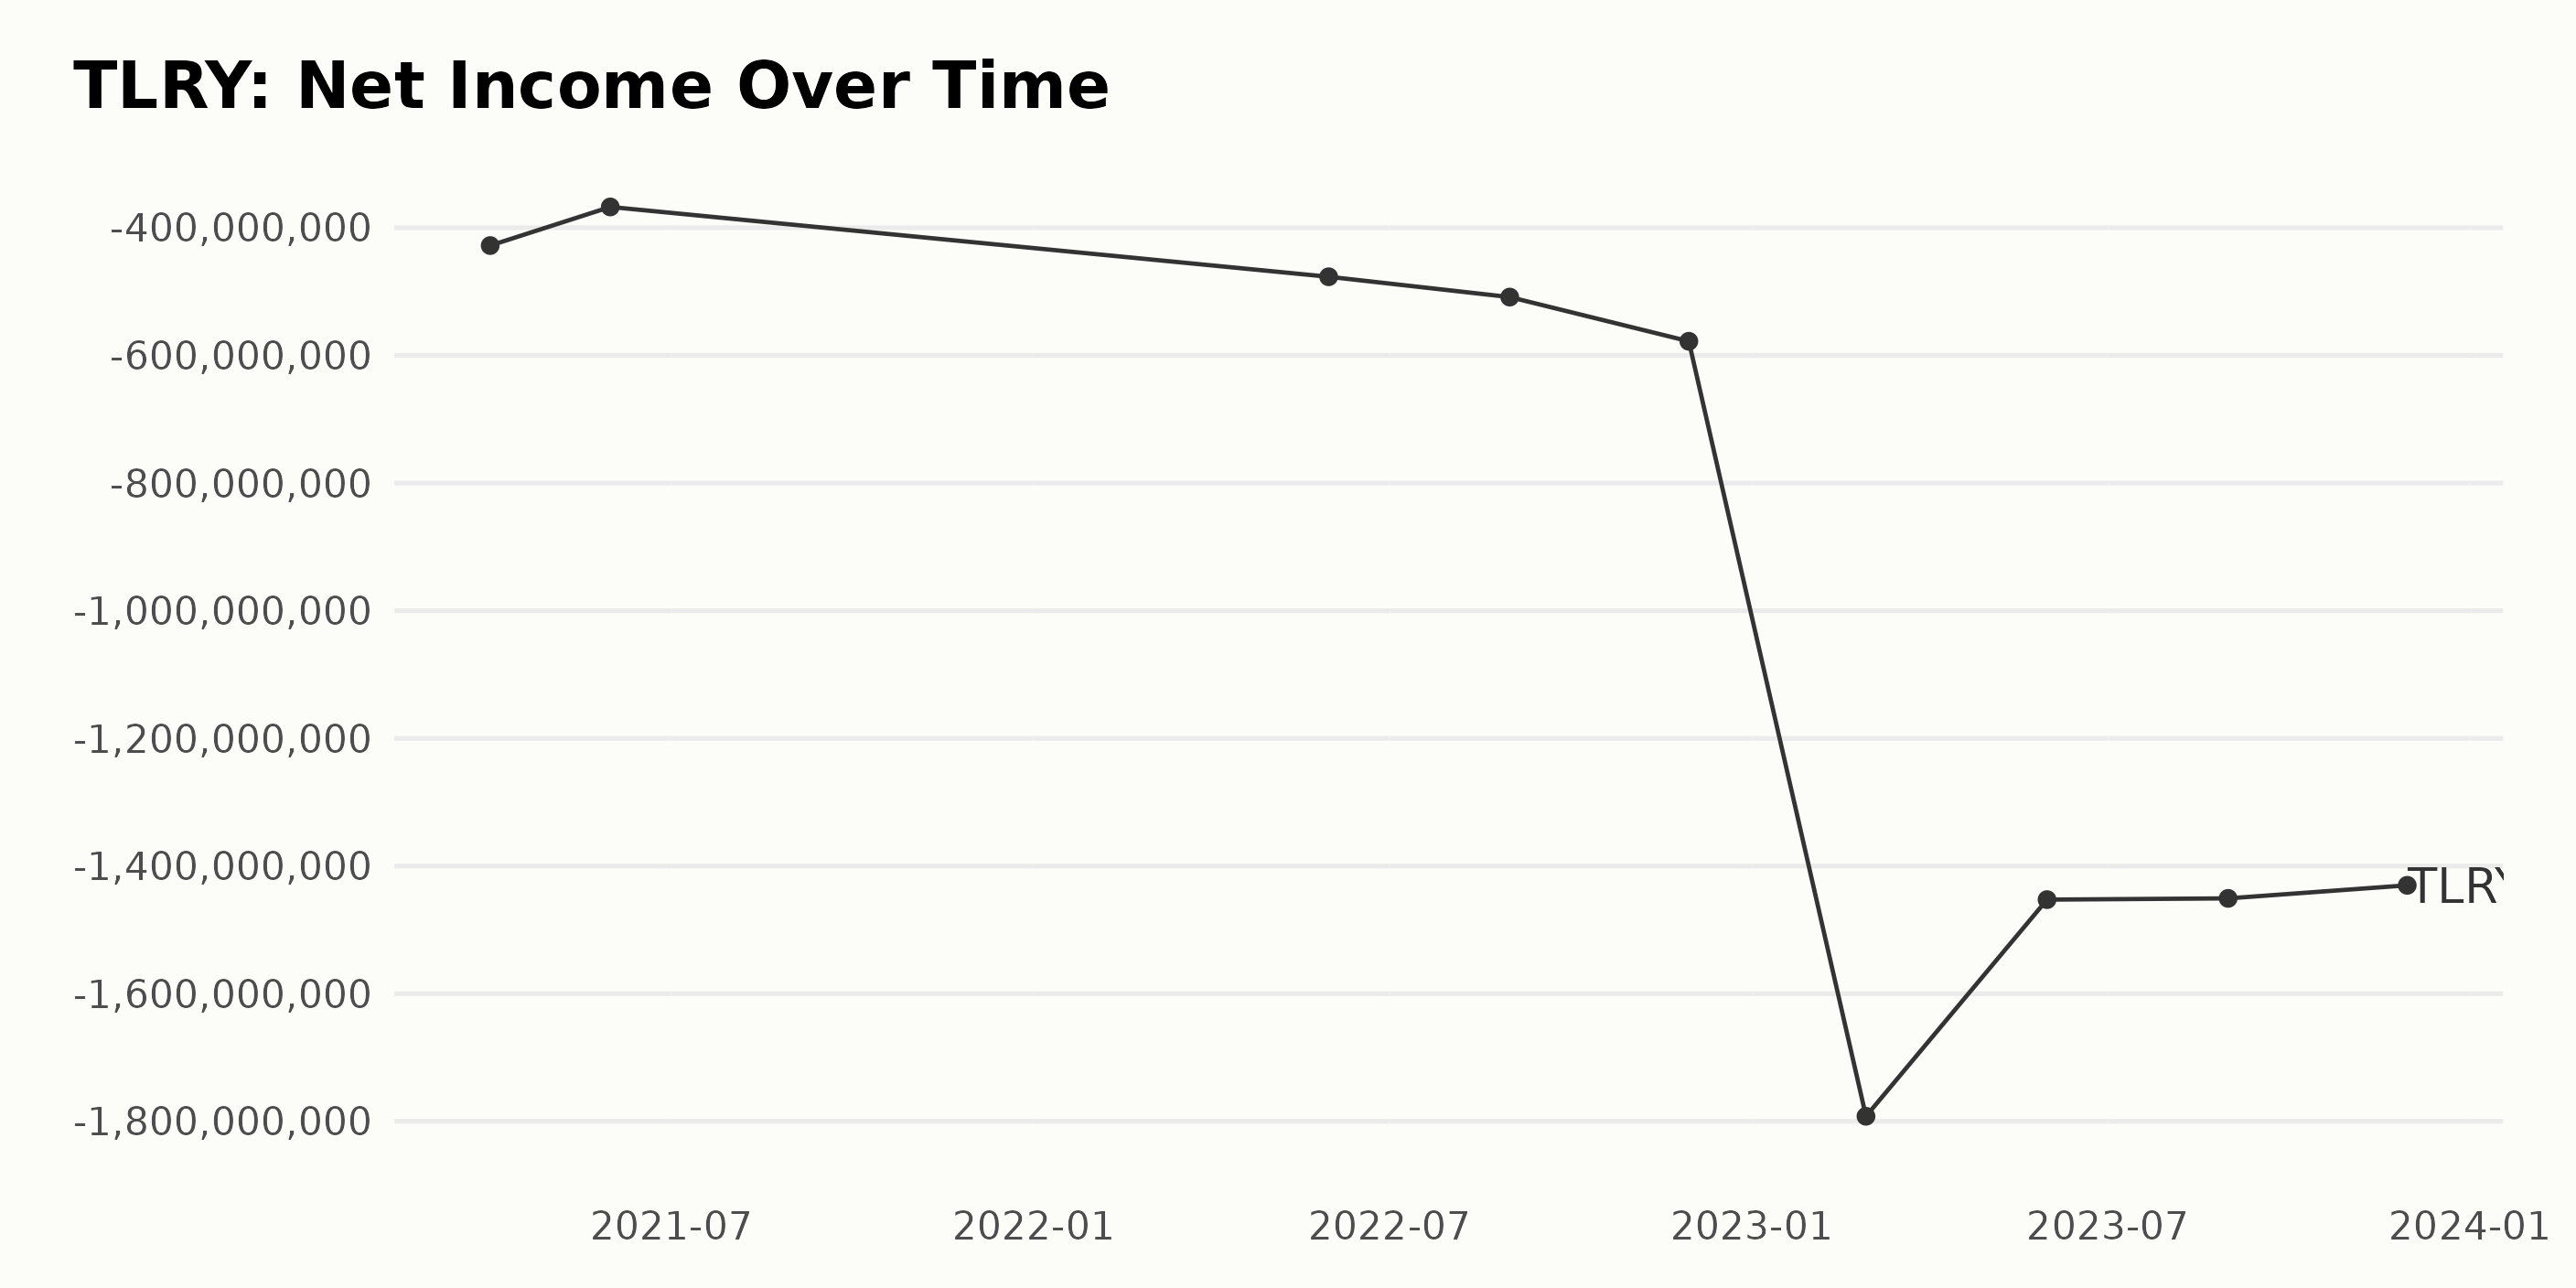
The trend and fluctuation of the trailing-12-month Net Income of TLRY have been negatively significant over the time series. Below is a breakdown of the series:
- As of March 31, 2021, TLRY reported a Net Income deficit of -$427.91 million.
- As we progress to May 31, 2021, there was a slight improvement as the deficit reduced to -$367.42 million.
- A year later, as of May 31, 2022, we noted an increase in the Net Income deficit to -$476.8 million.
- By August 31, 2022, the reported Net Income showed a further shortfall of -$508.63 million.
- As of November 30, 2022, there was an alarming increase in the deficit to -$577.9 million.
- The downturn got worse as the Net Income registered a massive shortage of -$1.792 billion on February 28, 2023.
- There was a slight relief as the figures reported for May 31, 2023, came to -$1.4526 billion.
- This negligible relief continued into August 31, 2023, with a reported Net Income deficit of -$1.4507 billion.
- Ending the series on a relatively hopeful note, November 30, 2023, saw a deficit of -$1.4302 billion.
Clearly, the trends for TLRY's Net Income heavily favor a negative growth over this period. The deficit increased from -$427.91 million on March 31, 2021, to -$1.4302 billion on November 30, 2023. This reflects a tremendous negative growth rate. Prioritizing the recent data, the deficit appears to have decelerated slightly but still remains significantly high.
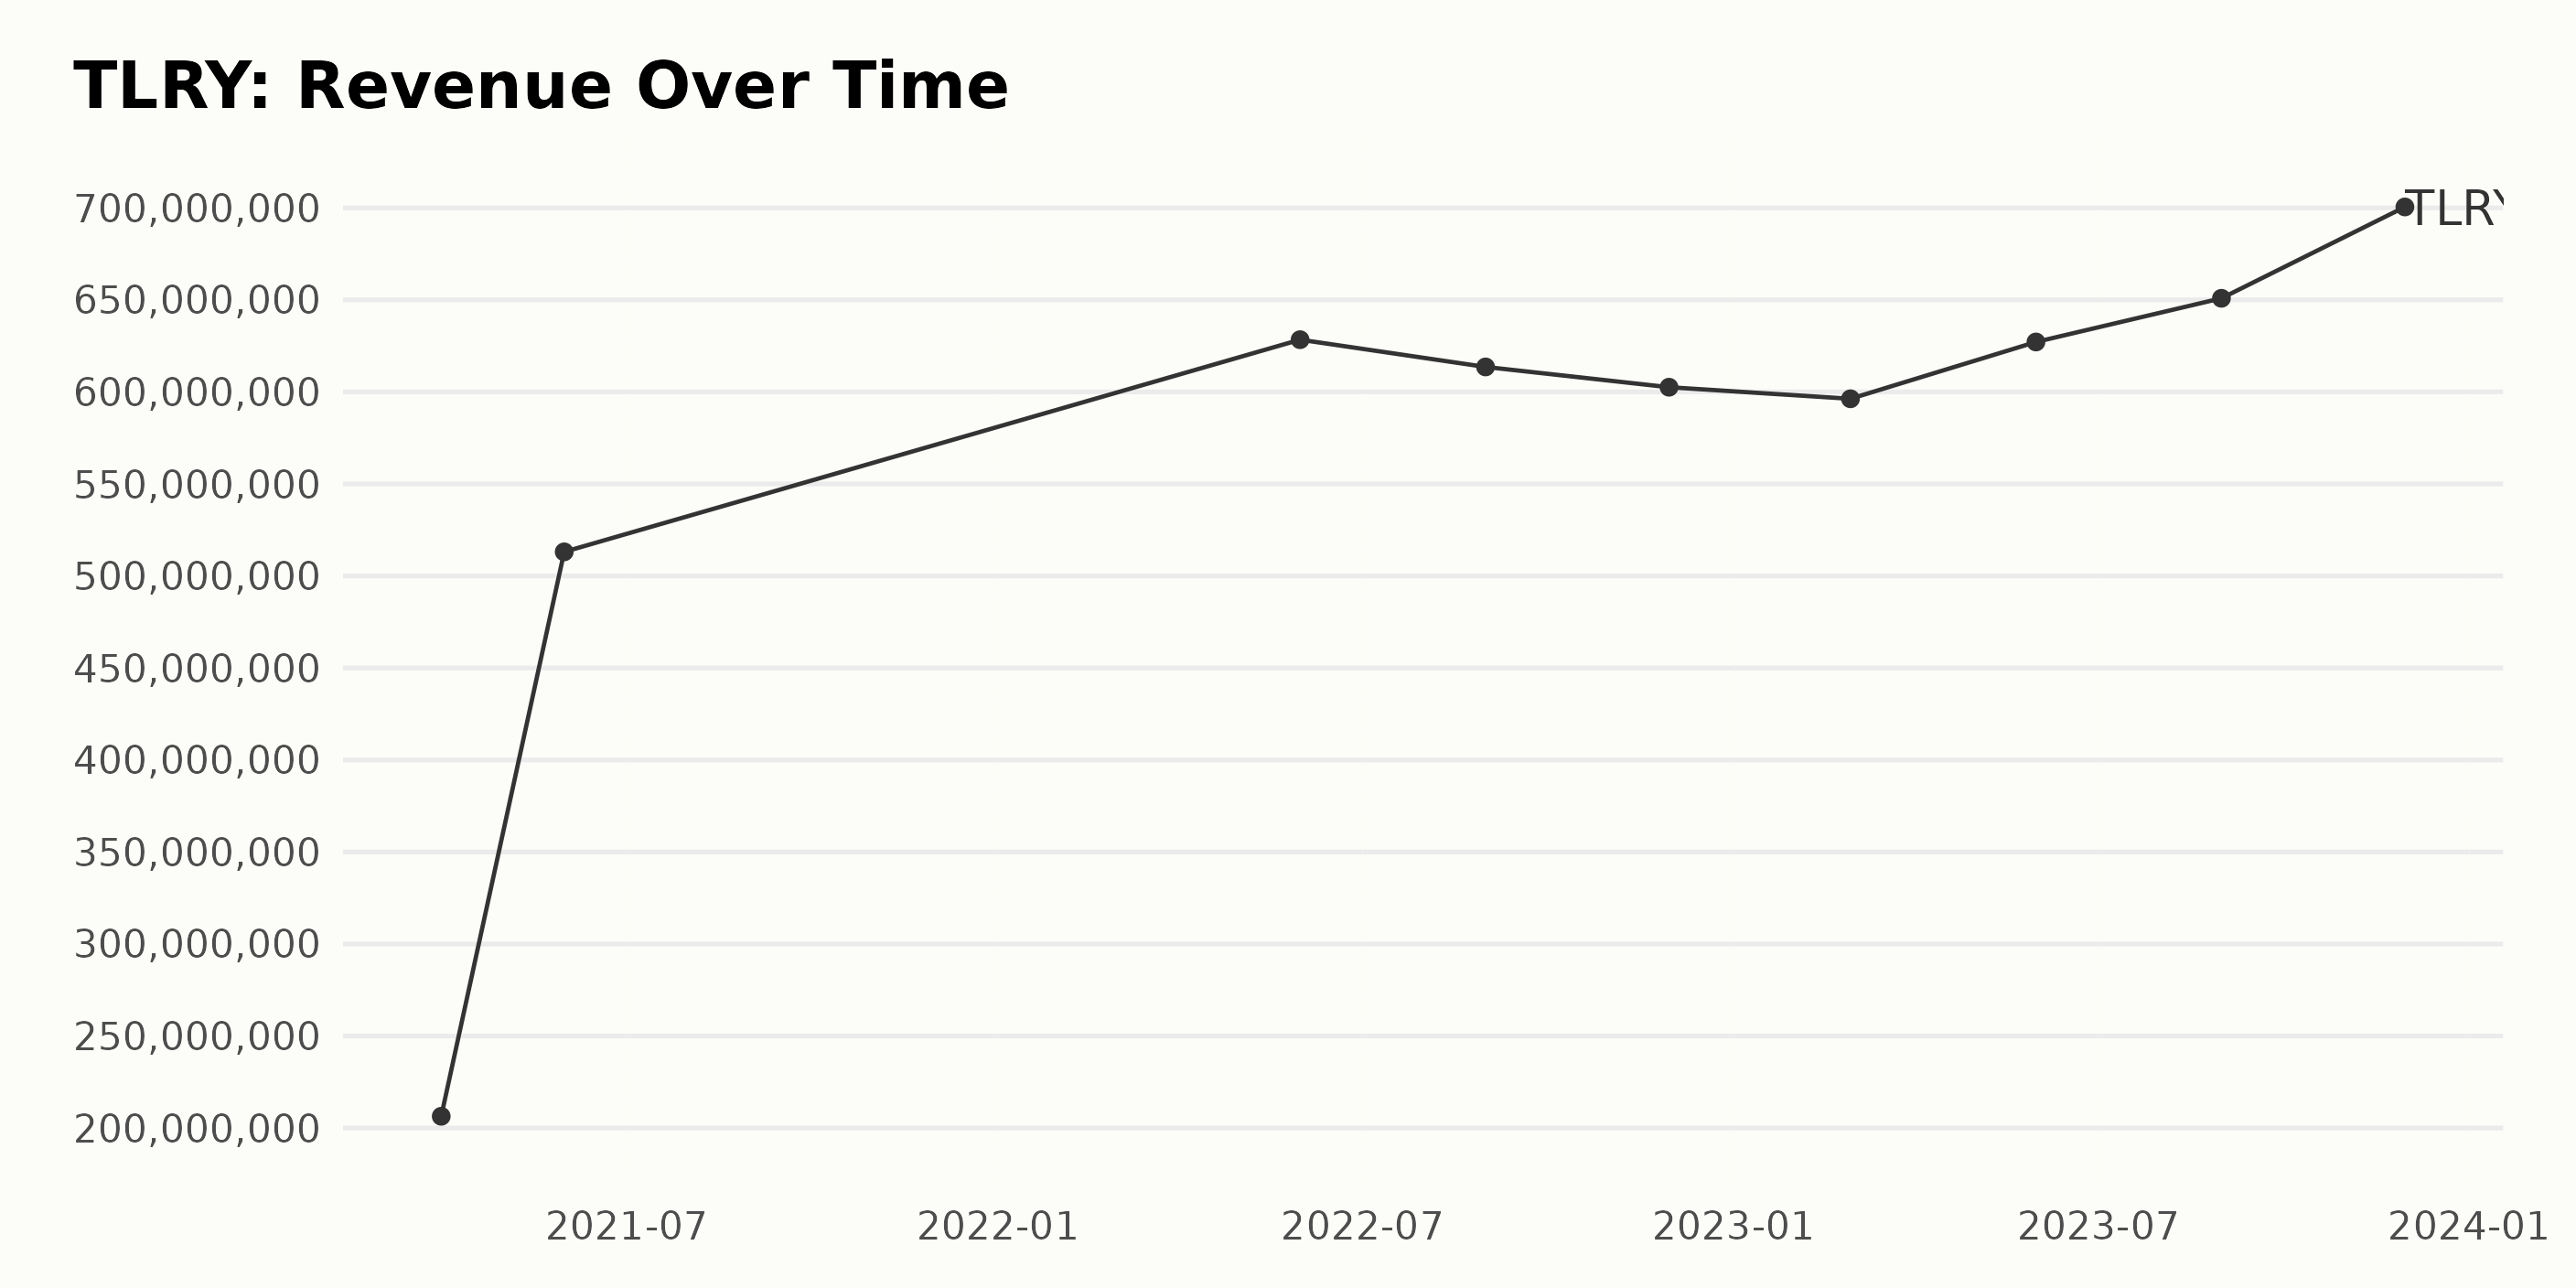
The trailing-12-month revenue of TLRY over the period from March 2021 to November 2023 has shown a general upward trend with some fluctuations.
- In March 2021, the revenue was at $206.4 million.
- By May 2021, it had more than doubled to $513.1 million.
- In May 2022, revenue peaked at $628.37 million, but started fluctuating downward in the later part of 2022 with $613.56 million in August and continued to slide to $602.54 million in November 2022 and $596.26 million in February 2023.
- However, beginning from May 2023, the revenue began to climb again reaching $627.12 million, and by August 2023 it was up to $650.86 million.
- The last recorded value in this series is from November 2023, where we see the highest point of $700.49 million.
The overall growth rate from the first recorded value in March 2021 to the last in November 2023 is approximately 239%, indicating an overall positive trajectory for TLRY's financial performance despite experiencing some periods of contraction within this period.
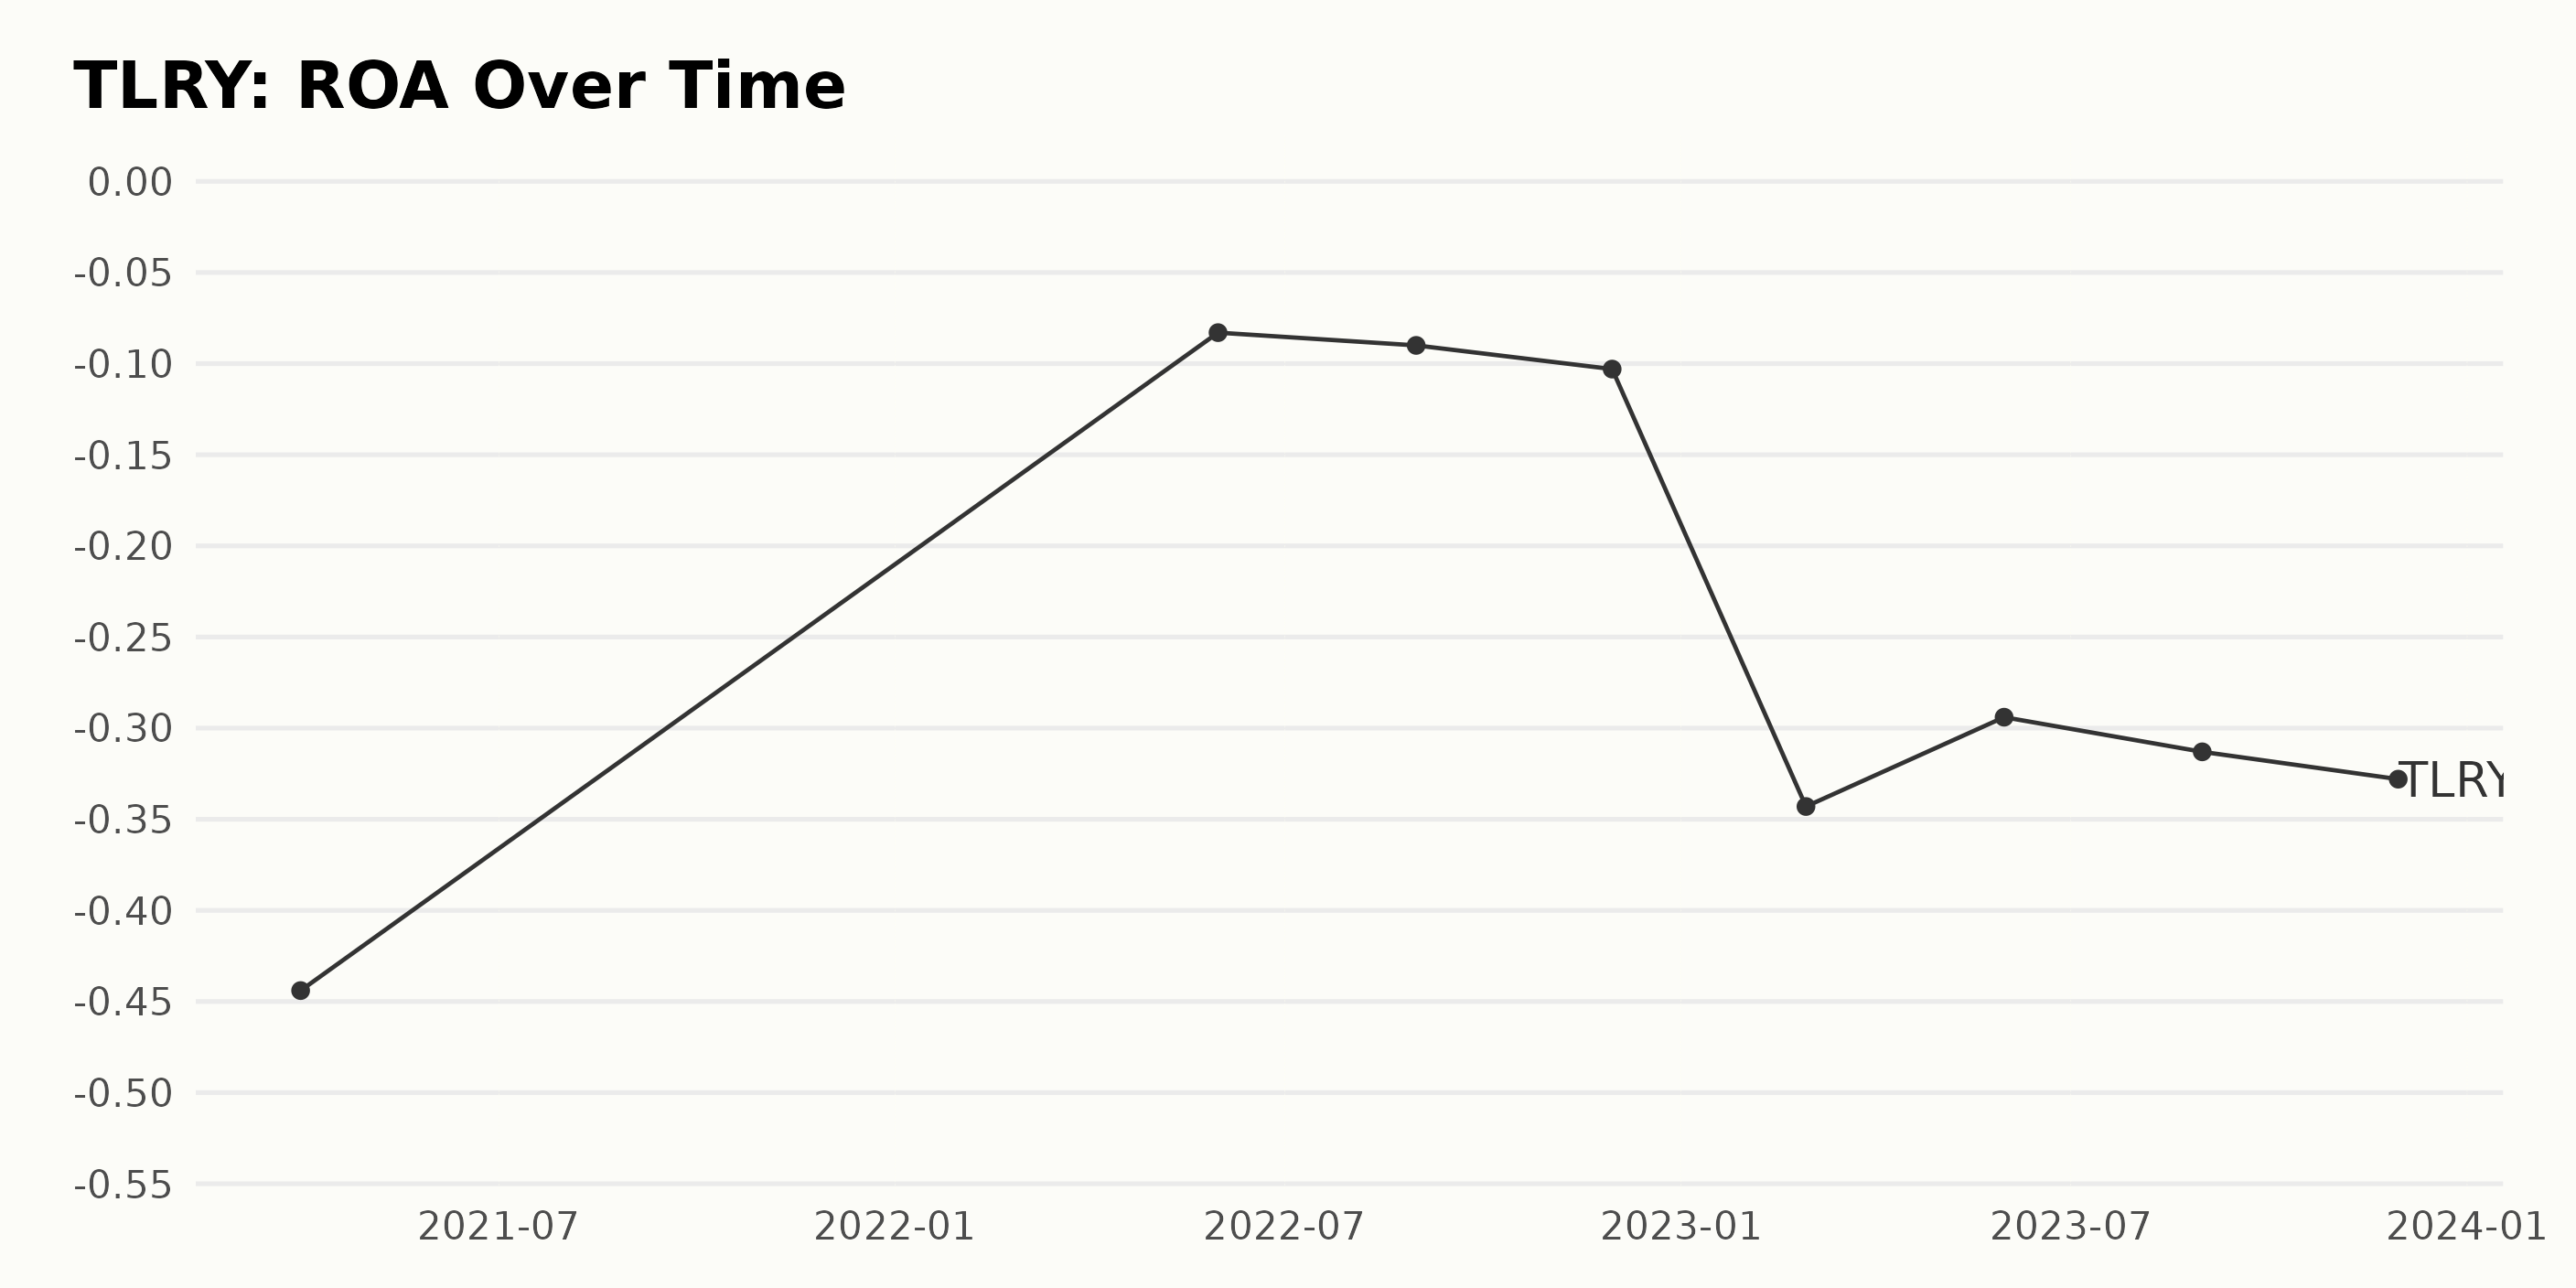
The trend and fluctuations of TLRY's ROA can be summarized as follows:
- The ROA for the publicly traded US company, TLRY, shows a negative trend over the period from March 2021 to November 2023.
- On March 31, 2021, the ROA was -44.4%. Despite a sharp improvement to -8.3% by May 31, 2022, it has progressively worsened since, with occasional fluctuations.
- Briefly, there was a marginal decline from May 31, 2022, to August 31, 2022, with ROA slipping from -8.3% to -9%. ROA slightly dropped again to -10.3% on November 30, 2022.
- A significant downward shift occurred by February 28, 2023, with the ROA deteriorating drastically to -34.3%.
- From February to May 2023, ROA showed signs of recovery, improving from -34.3% to -29.4%.
- This recovery was short-lived, with ROA dipping down to -31.3% on August 31, 2023, and further declining to -32.8% by November 30, 2023.
- Comparing the first and last values in the series, there is a decrease of 11.6%, indicating a negative growth rate over the period.
Greater emphasis should be placed on the more recent data, which exhibits a continuous downward trend. The last recorded ROA of -32.8% on November 30, 2023, highlights this concerning downward trajectory.
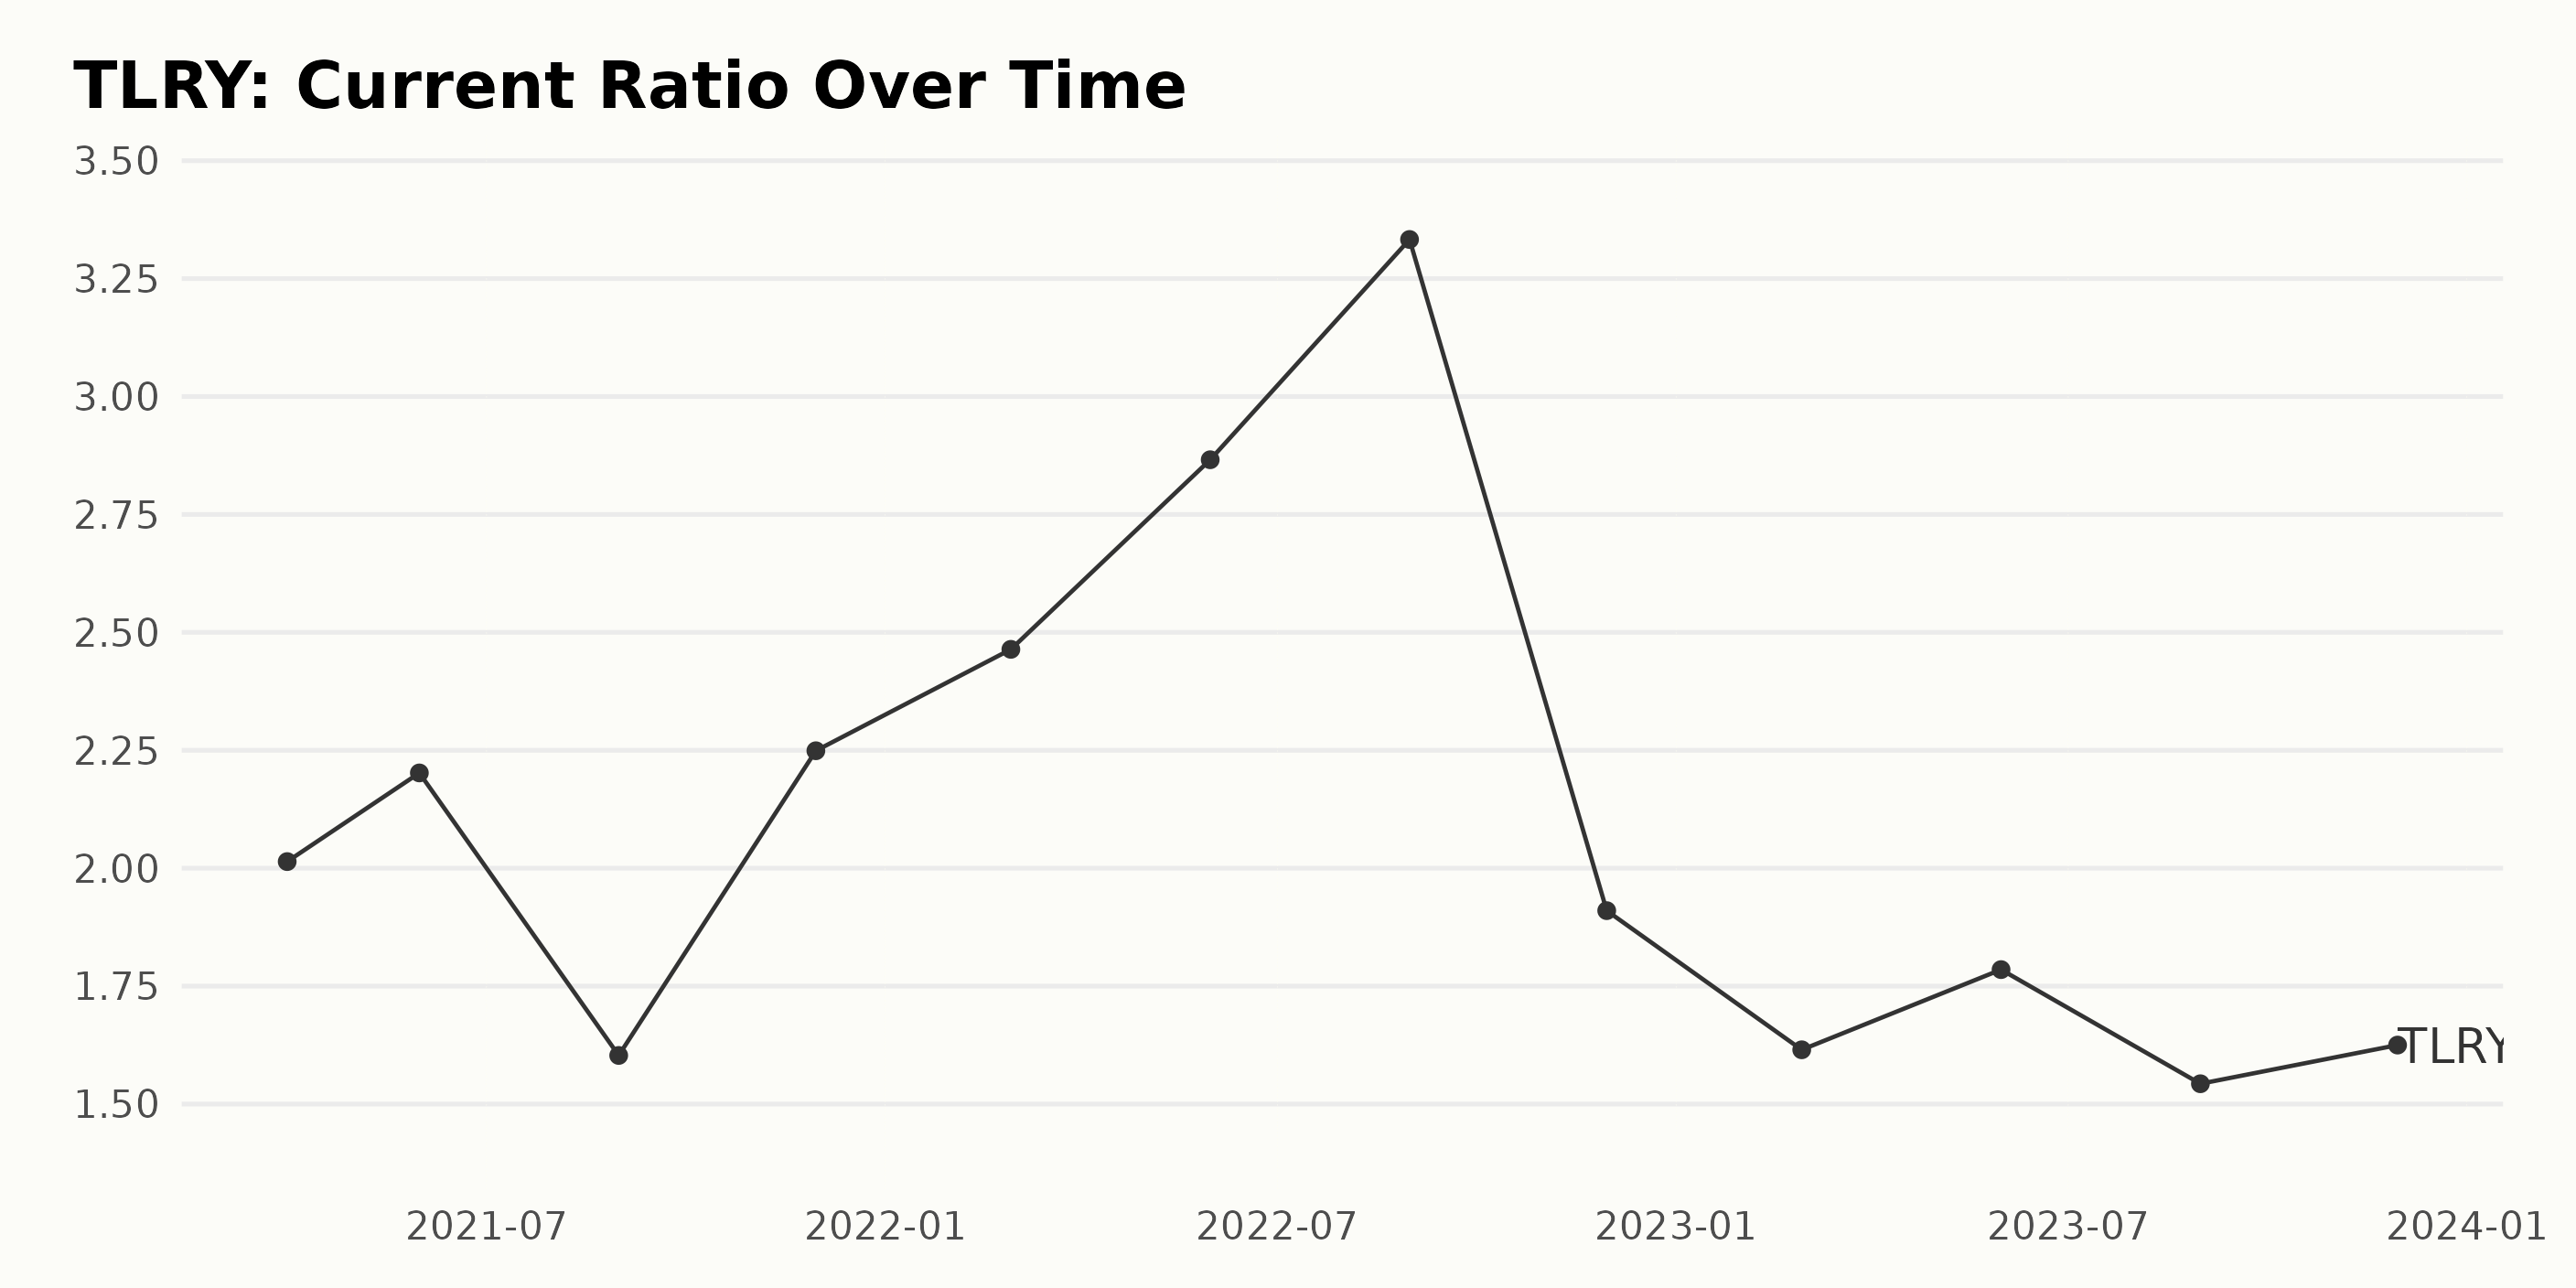
The Current Ratio trend and fluctuations of TLRY over the specified timeframe can be summarized as follows:
Overall Trend:
From March 2021 through November 2023, TLRY's Current Ratio exhibits a fluctuating pattern with a slight decline in the overall trend.
Yearly insights:
- 2021: The Current Ratio opened at 2.01 as of March 31. By May, TLRY's ratio increased to 2.20. However, there was a decline to 1.60 by August. In November, a significant rise occurred, reaching 2.25.
- 2022: This upward trend continued into the following year, peaking at 3.33 in August from 2.46 in February. But by the end of November, it dropped significantly to 1.91 owning to potential economic or operational conditions.
- 2023: Throughout 2023, the Current Ratio sees a relatively stable fluctuation between 1.54 and 1.78, with the final number in November at 1.62.
Growth Rate:
Comparing the first recorded value in March 2021 (2.01) and the last value in November 2023 (1.62), the Current Ratio decreased by approximately 19.4%. Important note about Current Ratio:
It's crucial to mention that the Current Ratio is a liquidity ratio that measures a company's ability to cover its short-term obligations with its short-term assets. A higher Current Ratio can indicate more financial flexibility, while a lower ratio might signal potential liquidity issues. This data should be considered along with other financial indicators and business context for reliable assessment.
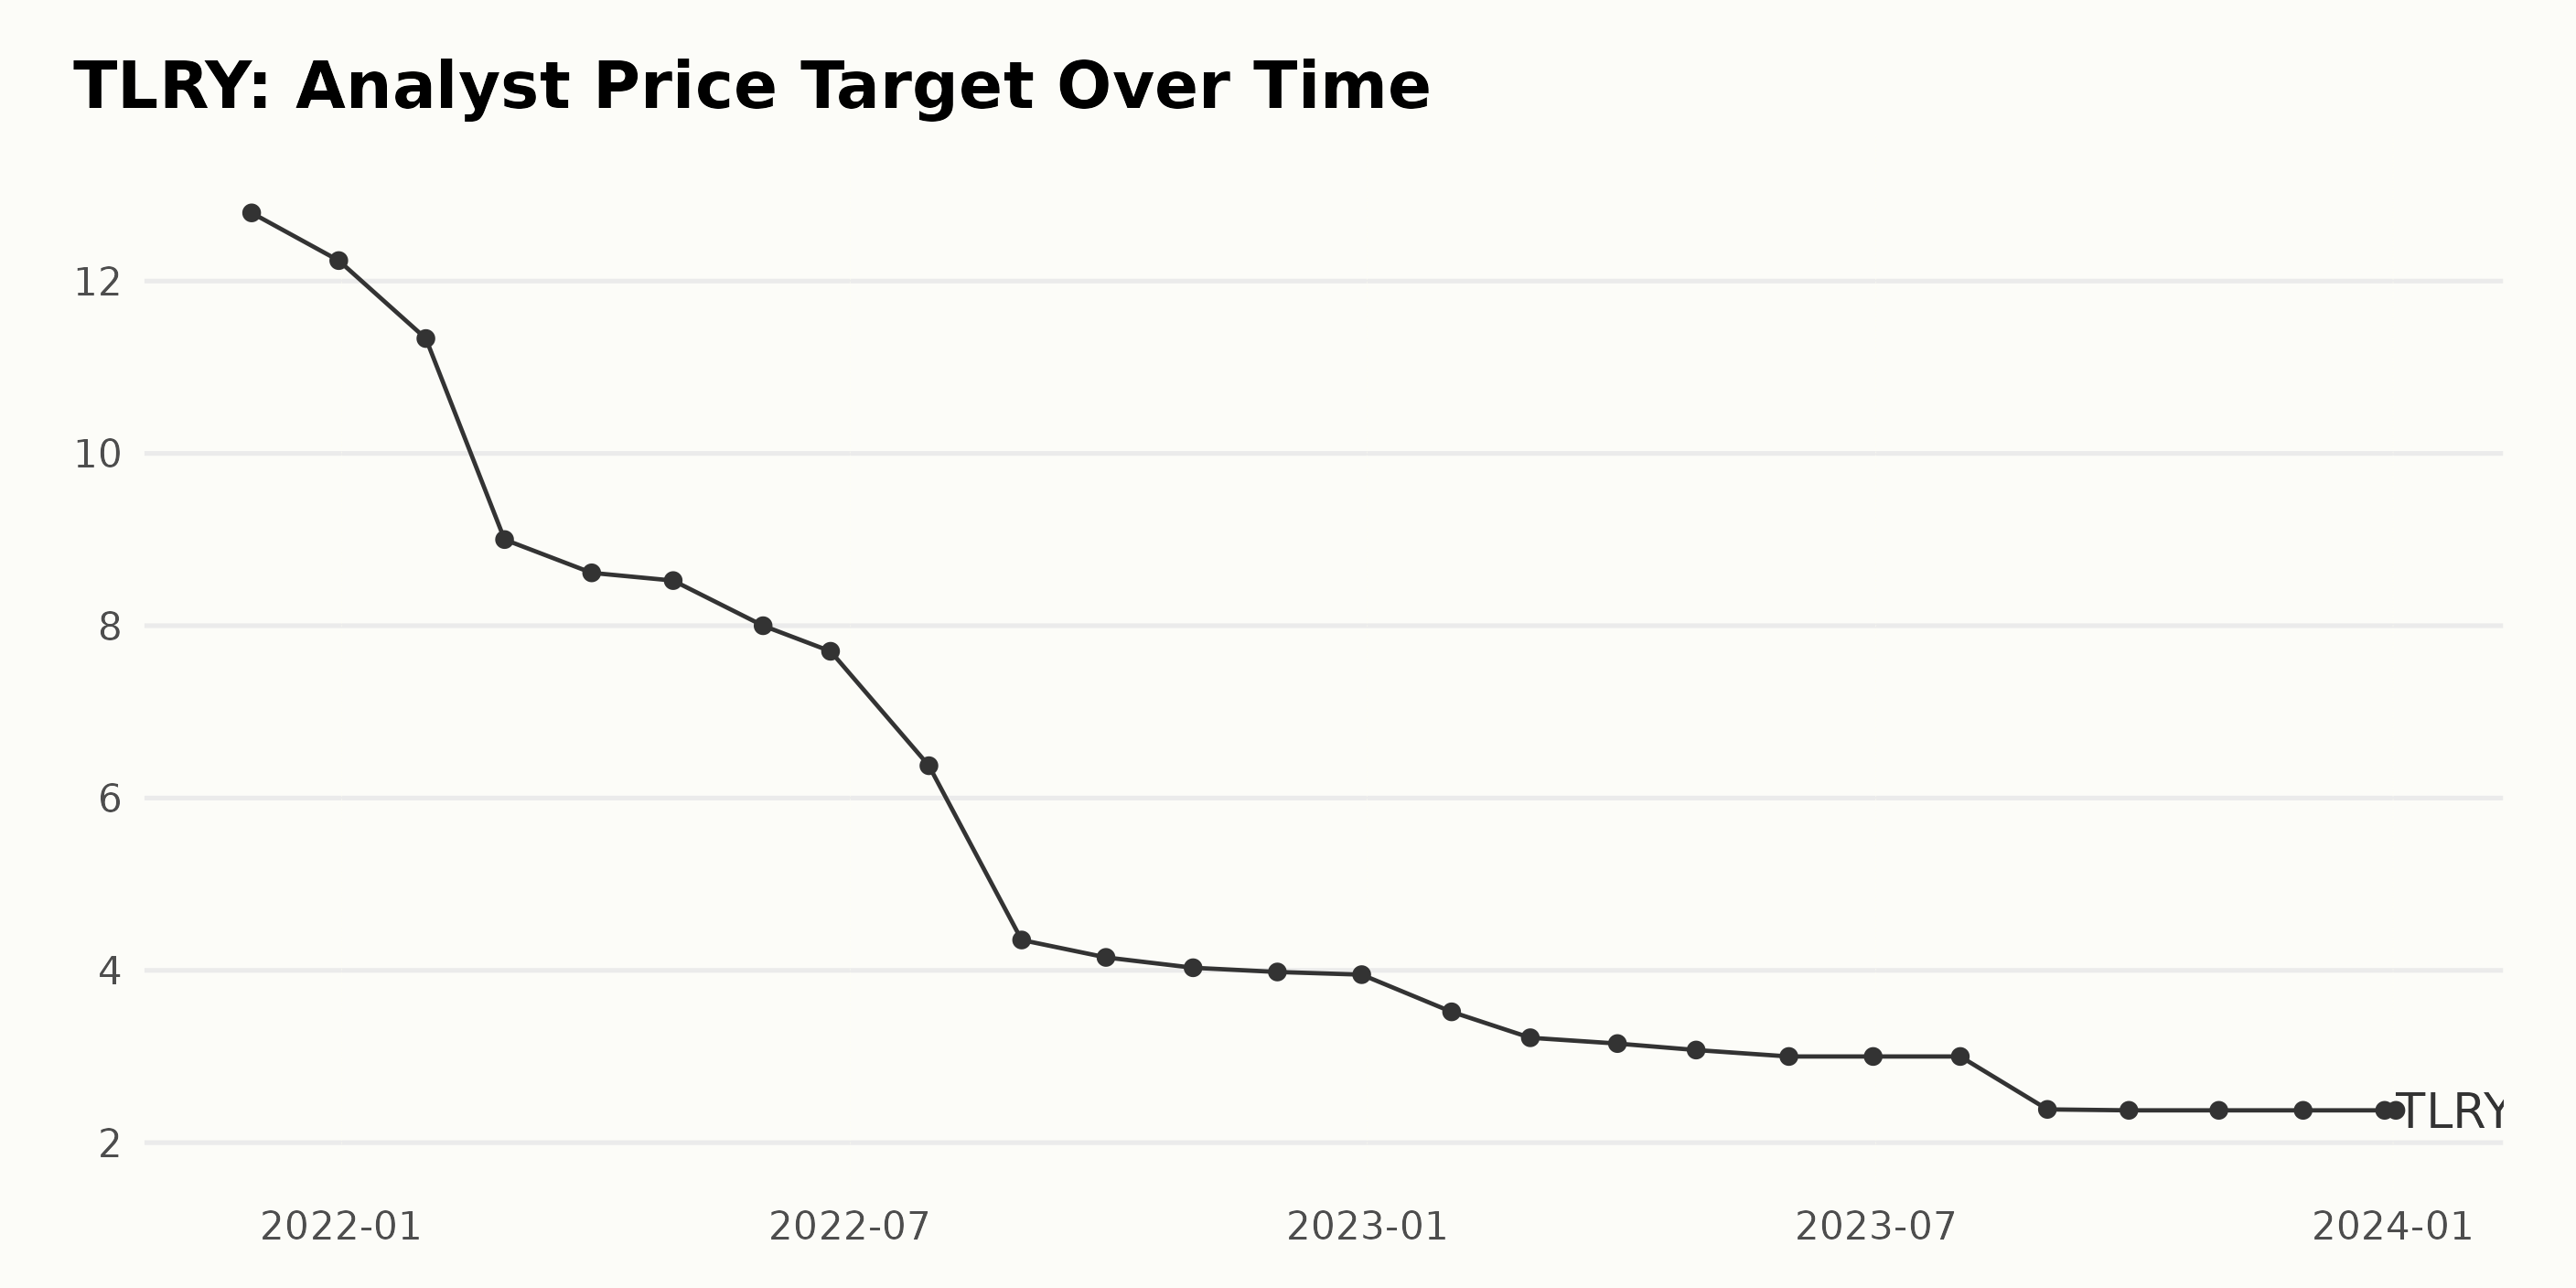
The Analyst Price Target for TLRY shows a steady downward trend from November 2021 to January 2024. Notable fluctuations include:
- In November 2021, the Analyst Price Target started at $12.79.
- By the end of 2021, it slightly decreased to $12.24.
- There was a significant drop to $9.00 in February 2022.
- From April to June 2022, the decline slowed down slightly, moving from $8.52 to $7.70.
- A larger drop occurred between June and August 2022, landing at $4.35 by the end of August.
- Then, from August 2022 to November 2022, the value saw minimal decreases, hovering around $4.00 area.
- Entering 2023, the figure continued to decrease, falling from $3.95 in December 2022 to $3.00 in May 2023 and maintaining this level until July 2023.
- Toward the end of 2023 and leading into early 2024, the value fell further to $2.38 and held constant into the early days of 2024.
Overall, the series displays a long-term downward trend with some periods of short-term stabilization. The growth rate, calculated by comparing the last value ($2.38) from the first value ($12.79), indicates a decrease of roughly 81% over the specified period. Please note that even within a general descending trend, there are intermittent periods of slower declines or stability is indicative of the target price's susceptibility to short-term market conditions while primarily obeying the longer term downward direction. The data ending in January 2024 demonstrates that this analysis places a greater emphasis on the most recent performance of TLRY’s Analyst Price Target.
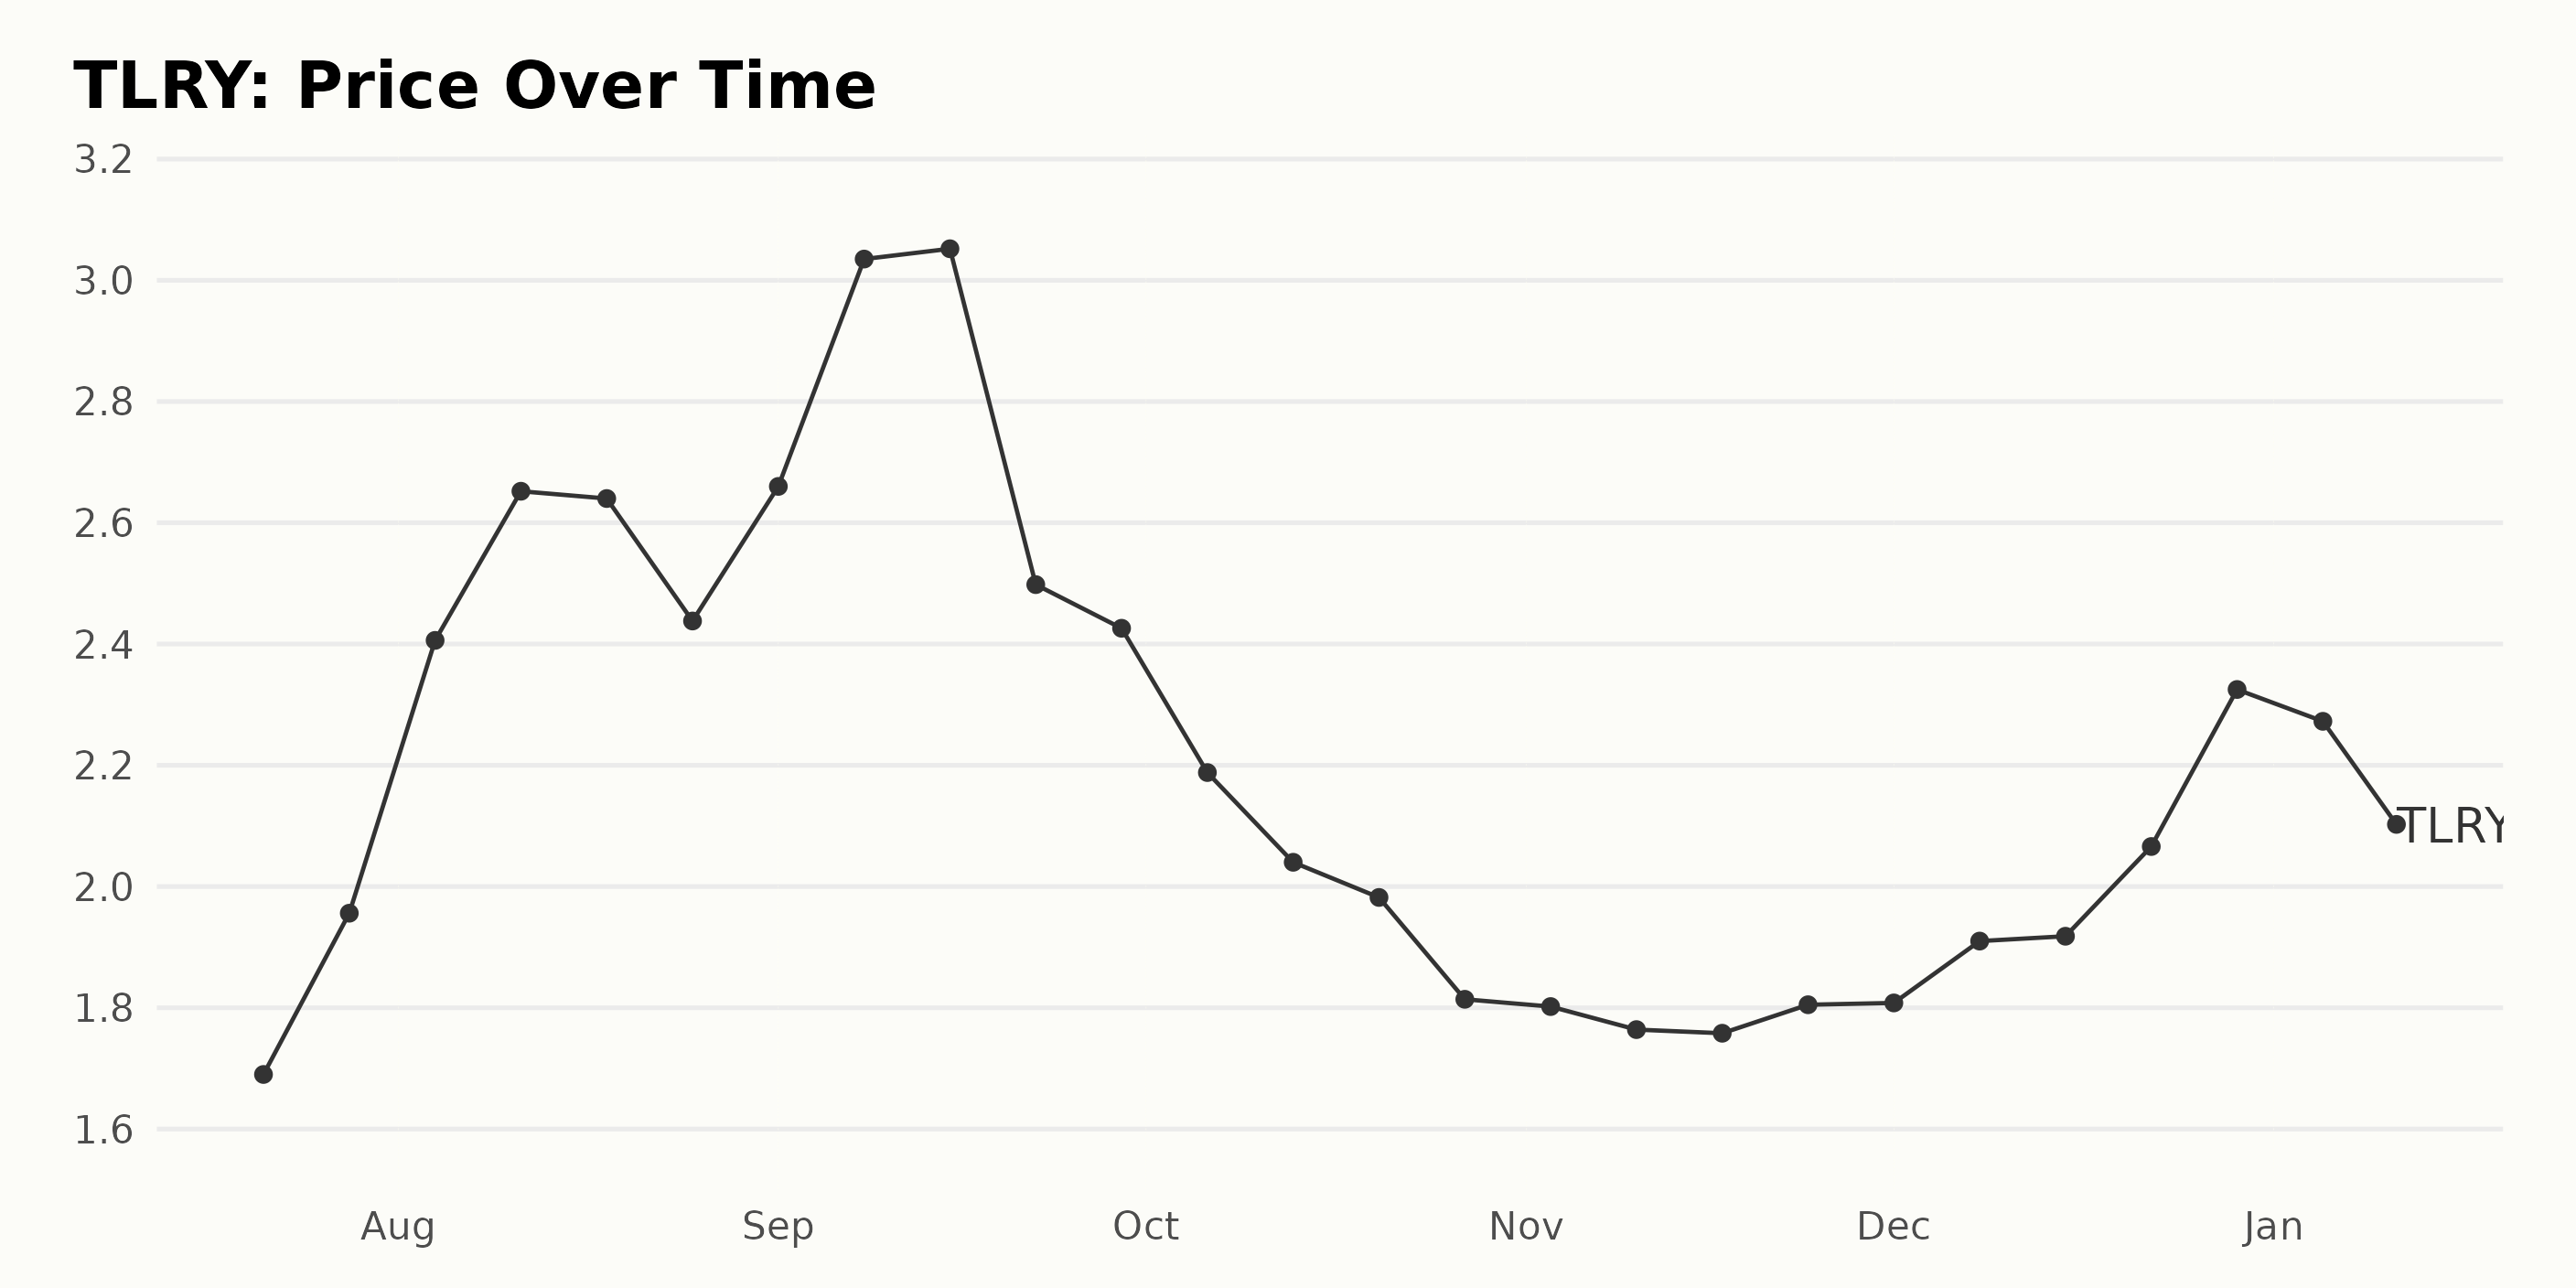
Analyzing TLRY Share Price Trends: Peaks, Dips and Recovery in 2023-24
Analyzing the provided TLRY share price data reveals a few discernible trends:
- Starting from July 21, 2023, when the share price was $1.69, there was a stiff upward trend through to September 15, 2023, when it peaked at $3.05
- This upward trend had an acceleration during early August 2023, with the share price quickly growing from $1.96 on July 28, 2023, to $2.65 by August 11, 2023.
- From mid-September 2023 through October 2023, there was a clear downward trend. By October 27, 2023, the share price had fallen to $1.81, representing a significant deceleration from its previous peak.
- In November 2023, the share price remained relatively static, fluctuating around the $1.8 range before demonstrating a slow and steady upward trend from December 2023 into early January 2024.
- By January 11, 2024 the share price had reached $2.10, a reduction from a high of $2.32 at the end of December 2023, indicating a possible deceleration in growth.
Over the overall period examined (from July 2023 through January 2024), the share price demonstrates periods of sharp growth followed by steeper declines and a final phase of slow recovery. The fastest growth can be observed in late July - early August 2023, and the hardest decline can be seen from mid-September 2023 through October 2023. After that, the rate of change gets milder. Here is a chart of TLRY's price over the past 180 days.
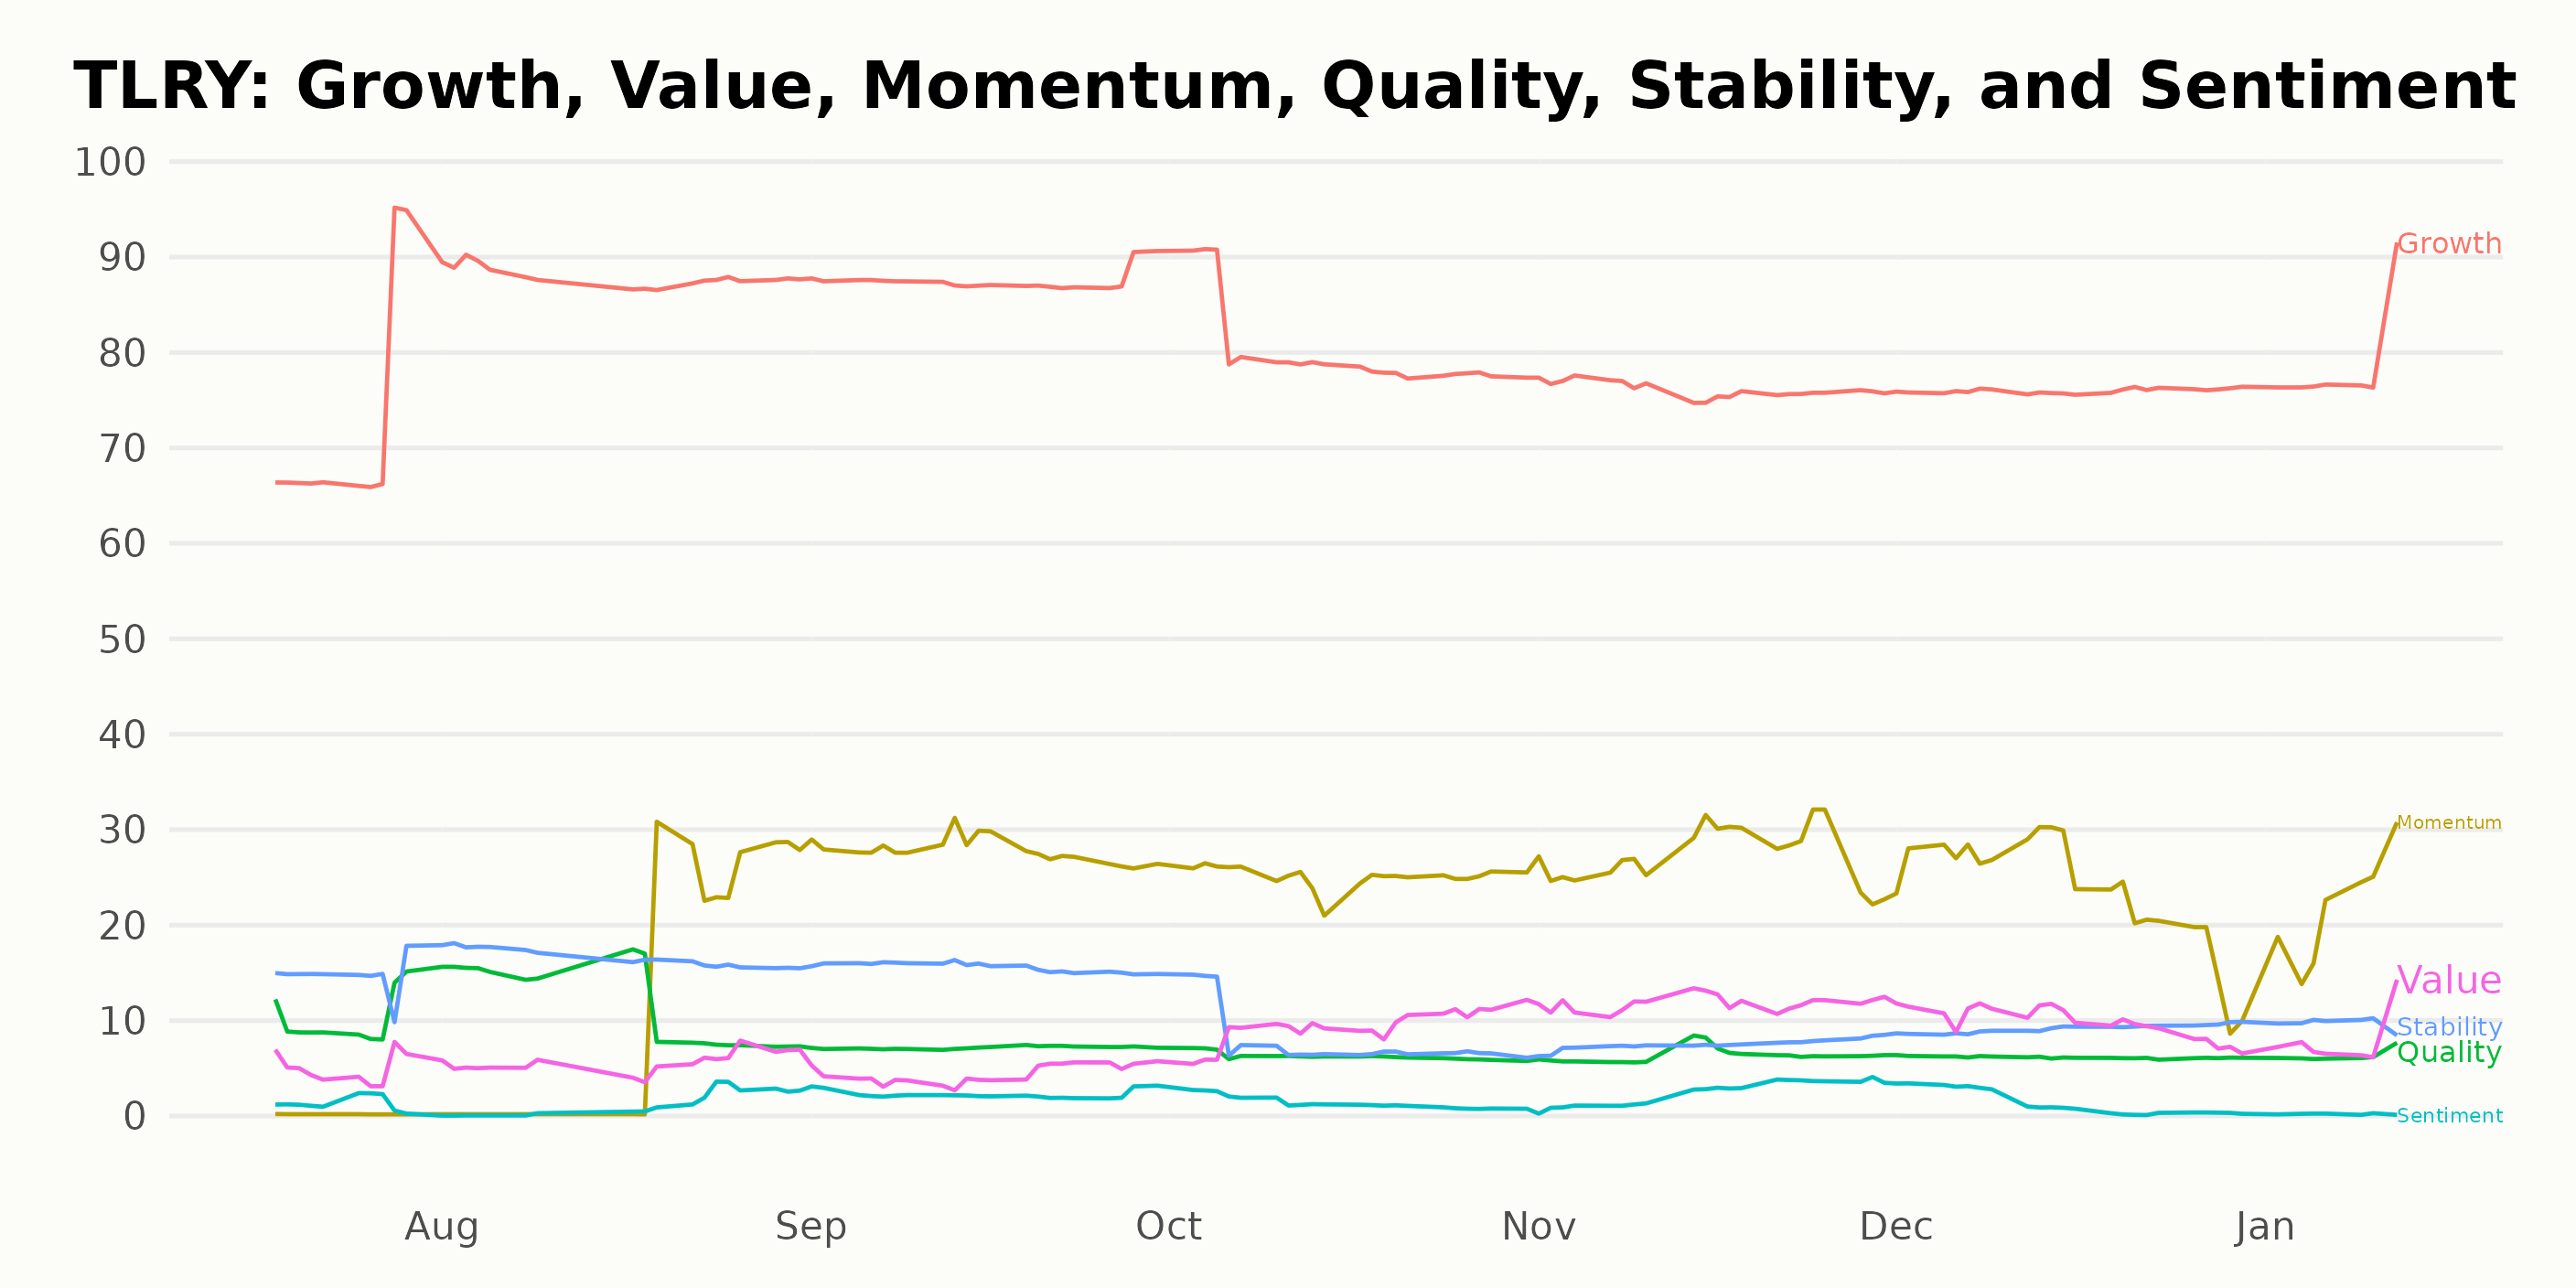
Exploring TLRY Stock's Growth, Momentum and Value Dimensions: A POWR Ratings Analysis
TLRY has an overall F rating, translating to a Strong Sell in our POWR Ratings system. It is ranked #149 out of the 161 stocks in the Medical - Pharmaceuticals category.
The POWR Ratings provide a broad assessment of a stock's overall viability and potential performance, considering certain crucial perspectives. We'll focus on the three most notable dimensions for TLRY based on the supplied data: Growth, Momentum, and Value.
Growth: This dimension consistently performed the highest across the multiple time frames. In July 2023, the Growth rating was 72, and it showed a considerable increase to 88 by August 2023. It slightly declined in the following months, hitting 76 in December 2023, but picked up again to 79 by January 12, 2024.
Momentum: The Momentum score presents an apparent upward trend. Although starting from a low rating of 0 in July 2023, it increased to 13 by August 2023. This upward trend continued to hold through the months, with minor fluctuations, reaching 22 by January 12, 2024.
Value: The Value dimension showed some inconsistencies over the period. Initially, in July 2023, it had a value of 5 which gradually increased to 12 by November 2023. It then mildly declined to 8 by January 12, 2024. In conclusion, the growth aspect for TLRY appears the most promising, being the highest-rated dimension throughout. There are clear upward trends in the momentum aspect. On the other hand, the value seems volatile without a clear pattern in its trend.
How does Tilray Brands, Inc. (TLRY) Stack Up Against its Peers?
Other stocks in the Medical - Pharmaceuticals sector that may be worth considering are SANTEN PHARMACEUTICAL CO., LTD. (SNPHY), Novo Nordisk A/S (NVO), and Bristol-Myers Squibb Company (BMY) -- they have better POWR Ratings.
What To Do Next?
Discover 10 widely held stocks that our proprietary model shows have tremendous downside potential. Please make sure none of these “death trap” stocks are lurking in your portfolio:
TLRY shares were trading at $1.86 per share on Friday afternoon, down $0.04 (-2.11%). Year-to-date, TLRY has declined -19.13%, versus a 0.36% rise in the benchmark S&P 500 index during the same period.
About the Author: Subhasree Kar

Subhasree’s keen interest in financial instruments led her to pursue a career as an investment analyst. After earning a Master’s degree in Economics, she gained knowledge of equity research and portfolio management at Finlatics.
The post Tilray Brands (TLRY) Earnings Spotlight -- Buy or Sell? appeared first on StockNews.com