T-Mobile US, Inc. (TMUS) has seen a significant surge in its share price, fueled primarily by several favorable developments within the organization. These include the opening of new retail outlets and an expansion in the coverage and capacity of its 5G network.
In the most recent quarter, T-Mobile reported leading customer growth in the industry, further bolstering its stance in the sector. Additionally, the merger with Sprint has solidified T-Mobile's standing in the wireless space.
Earlier this month, the company reached another milestone, testing a 5G standalone millimeter wave on its production network, delivering speeds topping 4.3 Gbps. This feat places T-Mobile in a strong position for sustained growth in the future.
However, insiders' substantial sale of stakes in the company over the past year may have raised concerns among shareholders. When stakeholders within the company offload shares over a specific period, it is often interpreted as a potential warning sign. This could indicate a lack of confidence in the company's future or a belief that the current value of the stock is inflated.
On December 15, 2023, Deeanne King, the Executive Vice President & Chief People Officer of TMUS, sold 24,328 shares. This event aligns with the trend in T’s insider activity over the past year, which shows an increase in insider selling and no insider buying.
As such, investors are advised to closely monitor insider activities alongside other relevant financial metrics in order to make the right investment decisions.
Drespite the recent positive strides, Wall Street analysts predict a 2.8% decrease in the company's revenue for the current quarter. Given these uncertainties, it might be prudent for prospective investors to bide their time in search of a more optimal entry point into the stock. A closer look at some of its fundamental performance indicators may be insightful.
Financial Performance Evaluation of T-Mobile US Inc. From 2020 to 2023
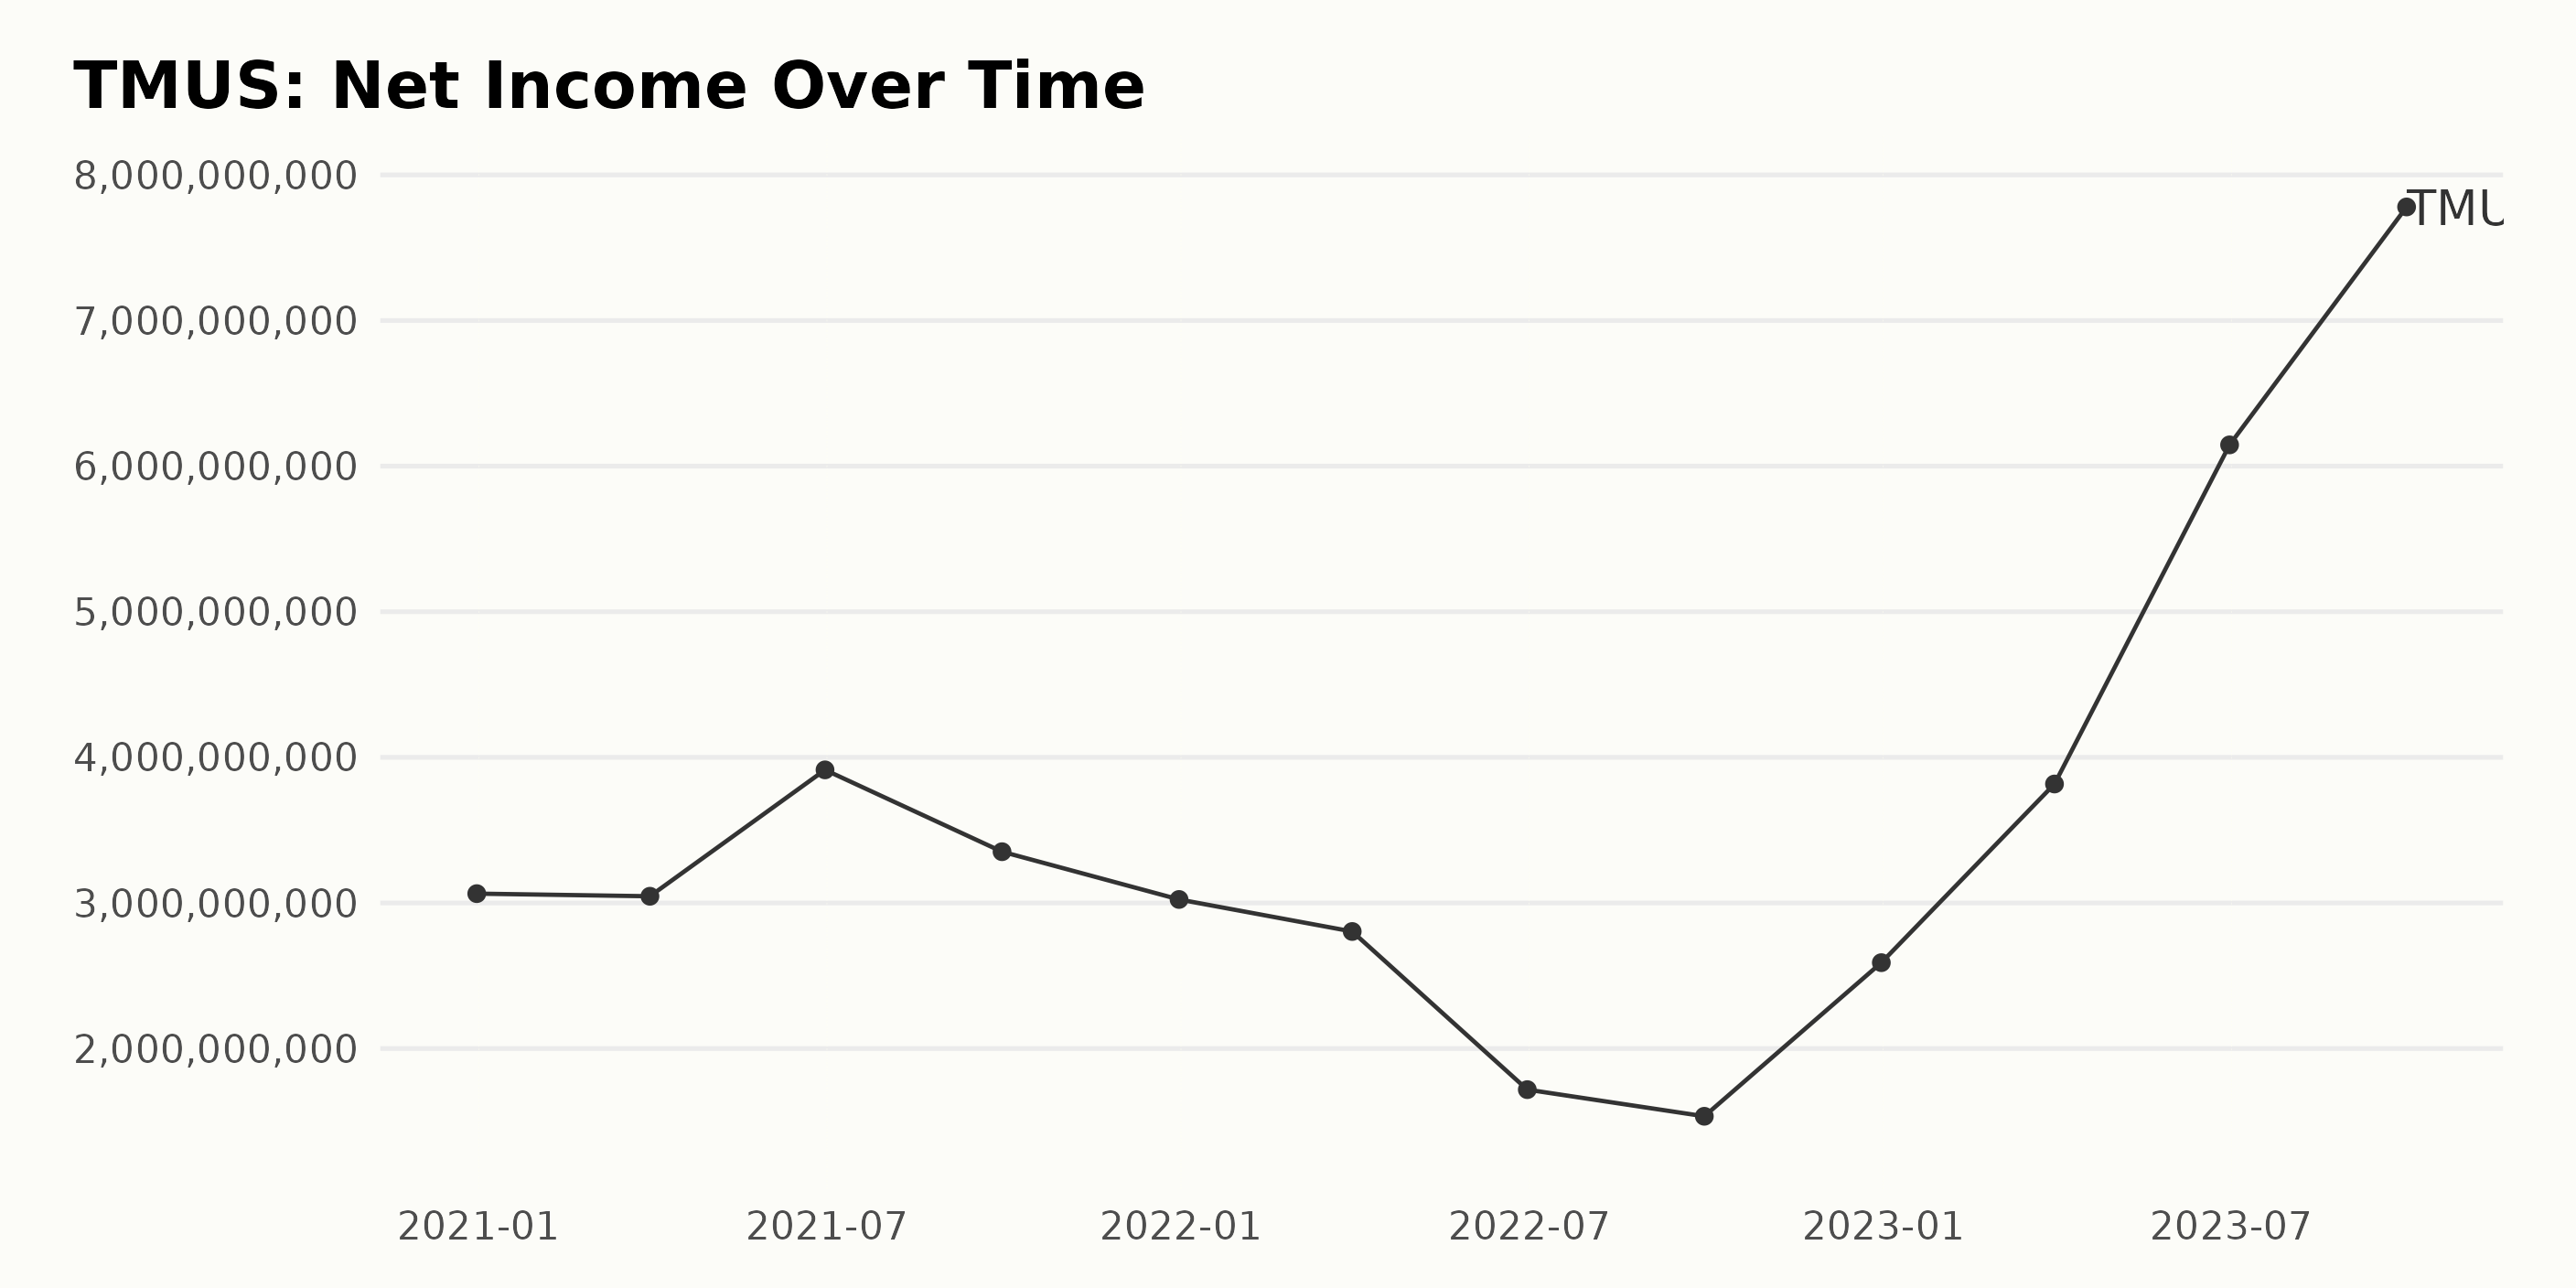
T-Mobile US Inc. (TMUS) saw a fluctuating trend in its trailing-12-month Net Income in the recent years according to given series of data:
- In 2020, on December 31, the net income stood at $3.06 billion. There was a minor downtrend at the start of 2021, with a net income of $3.04 billion on March 31.
- An uptrend was observed until mid-2021, with the net income peaking at $3.91 billion on June 30.
- After a decline to $3.35 billion by September 30, it ended the year at $3.02 billion. The net income in 2022 underwent significant fluctuation. It dropped to $2.80 billion at the end of the first quarter and $1.72 billion by mid-year, followed by a trough of $1.53 billion in third quarter. However, it saw an improvement by the end of year reaching $2.59 billion.
- Furthermore, the data for TMUS shows a notable upsurge throughout 2023.
- It rose significantly from $2.59 billion in December 31, 2022 to $3.82 billion on March 31.
- The growth trajectory continued in 2023 with the net income reaching its series high at $6.15 billion on June 30 and further escalating to a massive $7.78 billion on September 30, 2023.
The overall growth rate from December 2020 to September 2023, calculated by measuring the last value from the first, shows a significant increase of almost 154%. This denotes a substantial financial performance for the company, despite occasional fluctuations. However, since emphasis is placed more on the recent data, the growth trajectory seen in 2023 is of great relevance.
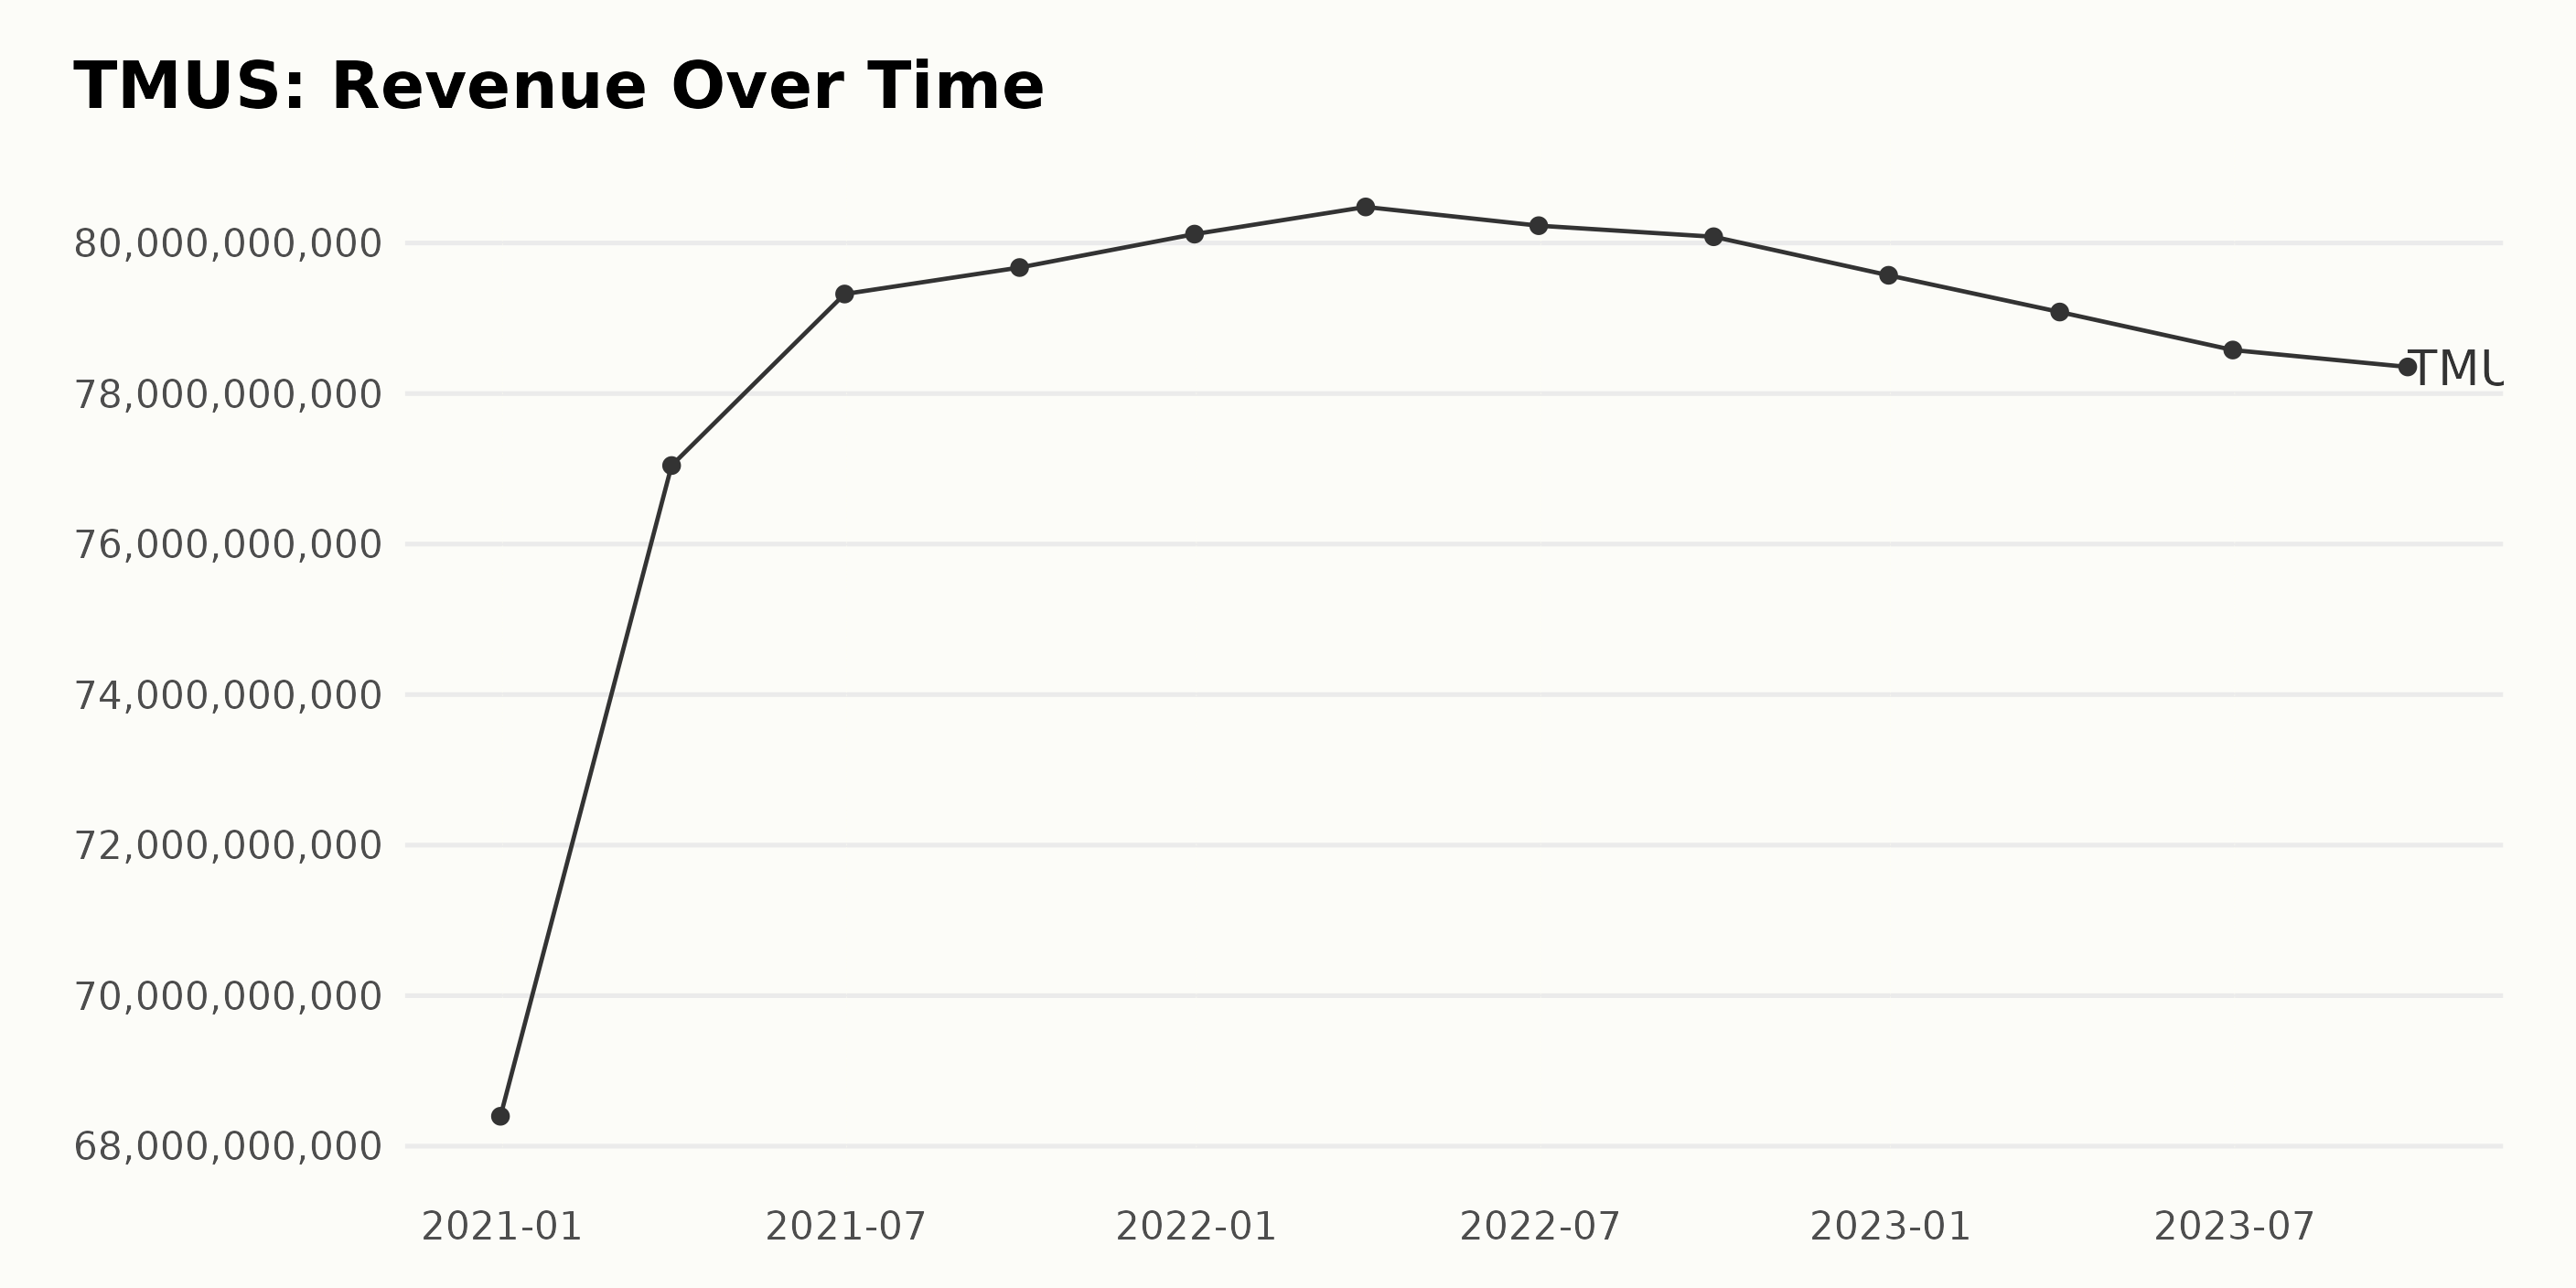
The trend and fluctuations in the trailing-12-month Revenue of TMUS from December 2020 to September 2023 show a progressive rise initially, followed by a gradual decline in more recent periods.
- At the end of the fourth quarter 2020, TMUS reported revenue of $68.40 billion.
- The numbers kept increasing with TMUS achieving its peak revenue in the first quarter 2022, reporting $80.48 billion.
- However, starting from the second quarter 2022, there is a noticeable slowdown in revenue with the company generating $80.23 billion, dropping to $80.08 billion by the end of the third quarter.
- Moving into 2023, the decline continues with TMUS reporting lesser revenues quarter after quarter, starting at $79.57 billion in the fourth quarter 2022, falling to $78.53 billion by the third quarter 2023.
In terms of the growth rate, measuring from the first value ($68.40 billion as of December 2020) to the last value ($78.53 billion as of September 2023), there is an overall increase of around 14.80%. However, it's important to note that the greater emphasis is given to more recent data, which indicates a downward trajectory in revenue from the first quarter 2022 onwards. This journey from the peak to the most recent data notably records a decreased growth rate, indicating a crucial need for strategic interventions to counter the declining revenue pattern.
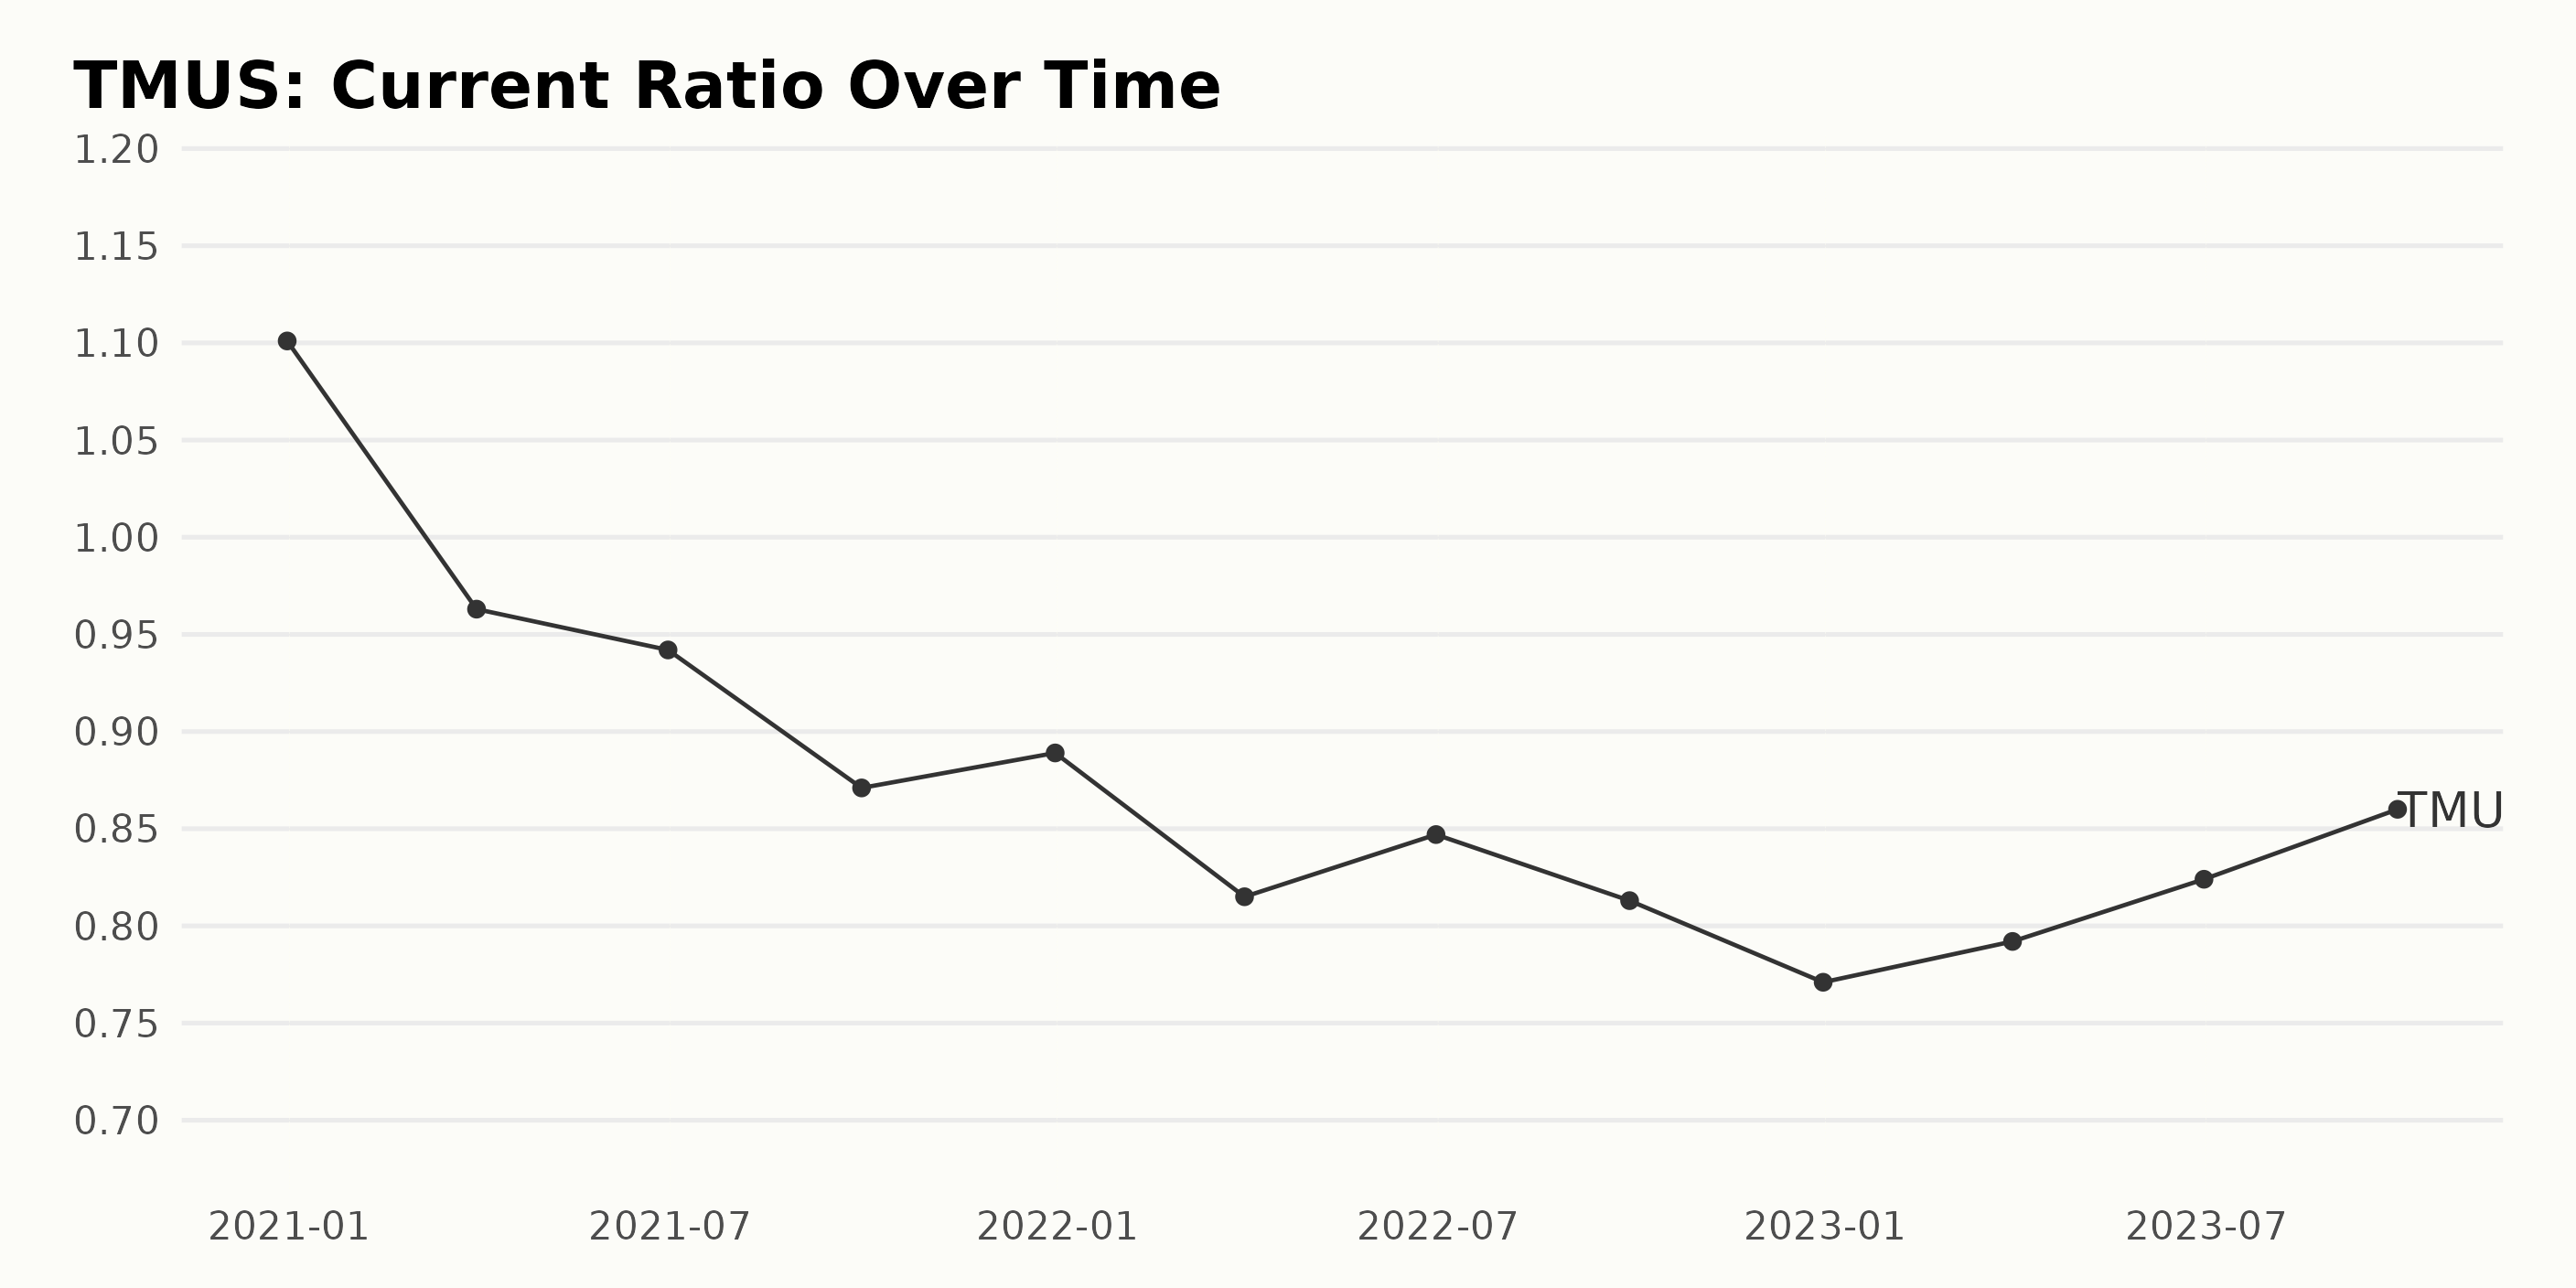
The Current Ratio of TMUS has been experiencing a general downward trend from December 31, 2020, to September 30, 2023, with some fluctuations.
- On December 31, 2020, the Current Ratio was at 1.10.
- By March 31, 2021, it dropped slightly to 0.96, marking a decrease in the company's ability to cover short-term liabilities with its short-term assets.
- Following minor decreases to 0.94 by June 30, 2021 and 0.87 by September 30, 2021, it slightly rose again to 0.89 by December 31, 2021.
- This rising trend didn't last, with the current ratio dropping successively to 0.82 on March 31, 2022, and then slightly increasing to 0.85 by the end of June 2022. From there, a fluctuating downward trend ensued until reaching 0.77 on December 31, 2022.
- Thereafter, the current ratio started to rebound upwards with numbers recorded at essentially a stable increase. As of the latest report on September 30, 2023, it stands at 0.86.
The overall growth rate from the initial value on December 31, 2020, to the last value on September 30, 2023, reveals a decrease of approximately 21.82%, indicating that the company's liquidity and ability to pay its short-term obligations have generally been deteriorating over this period, despite some periodic upticks.
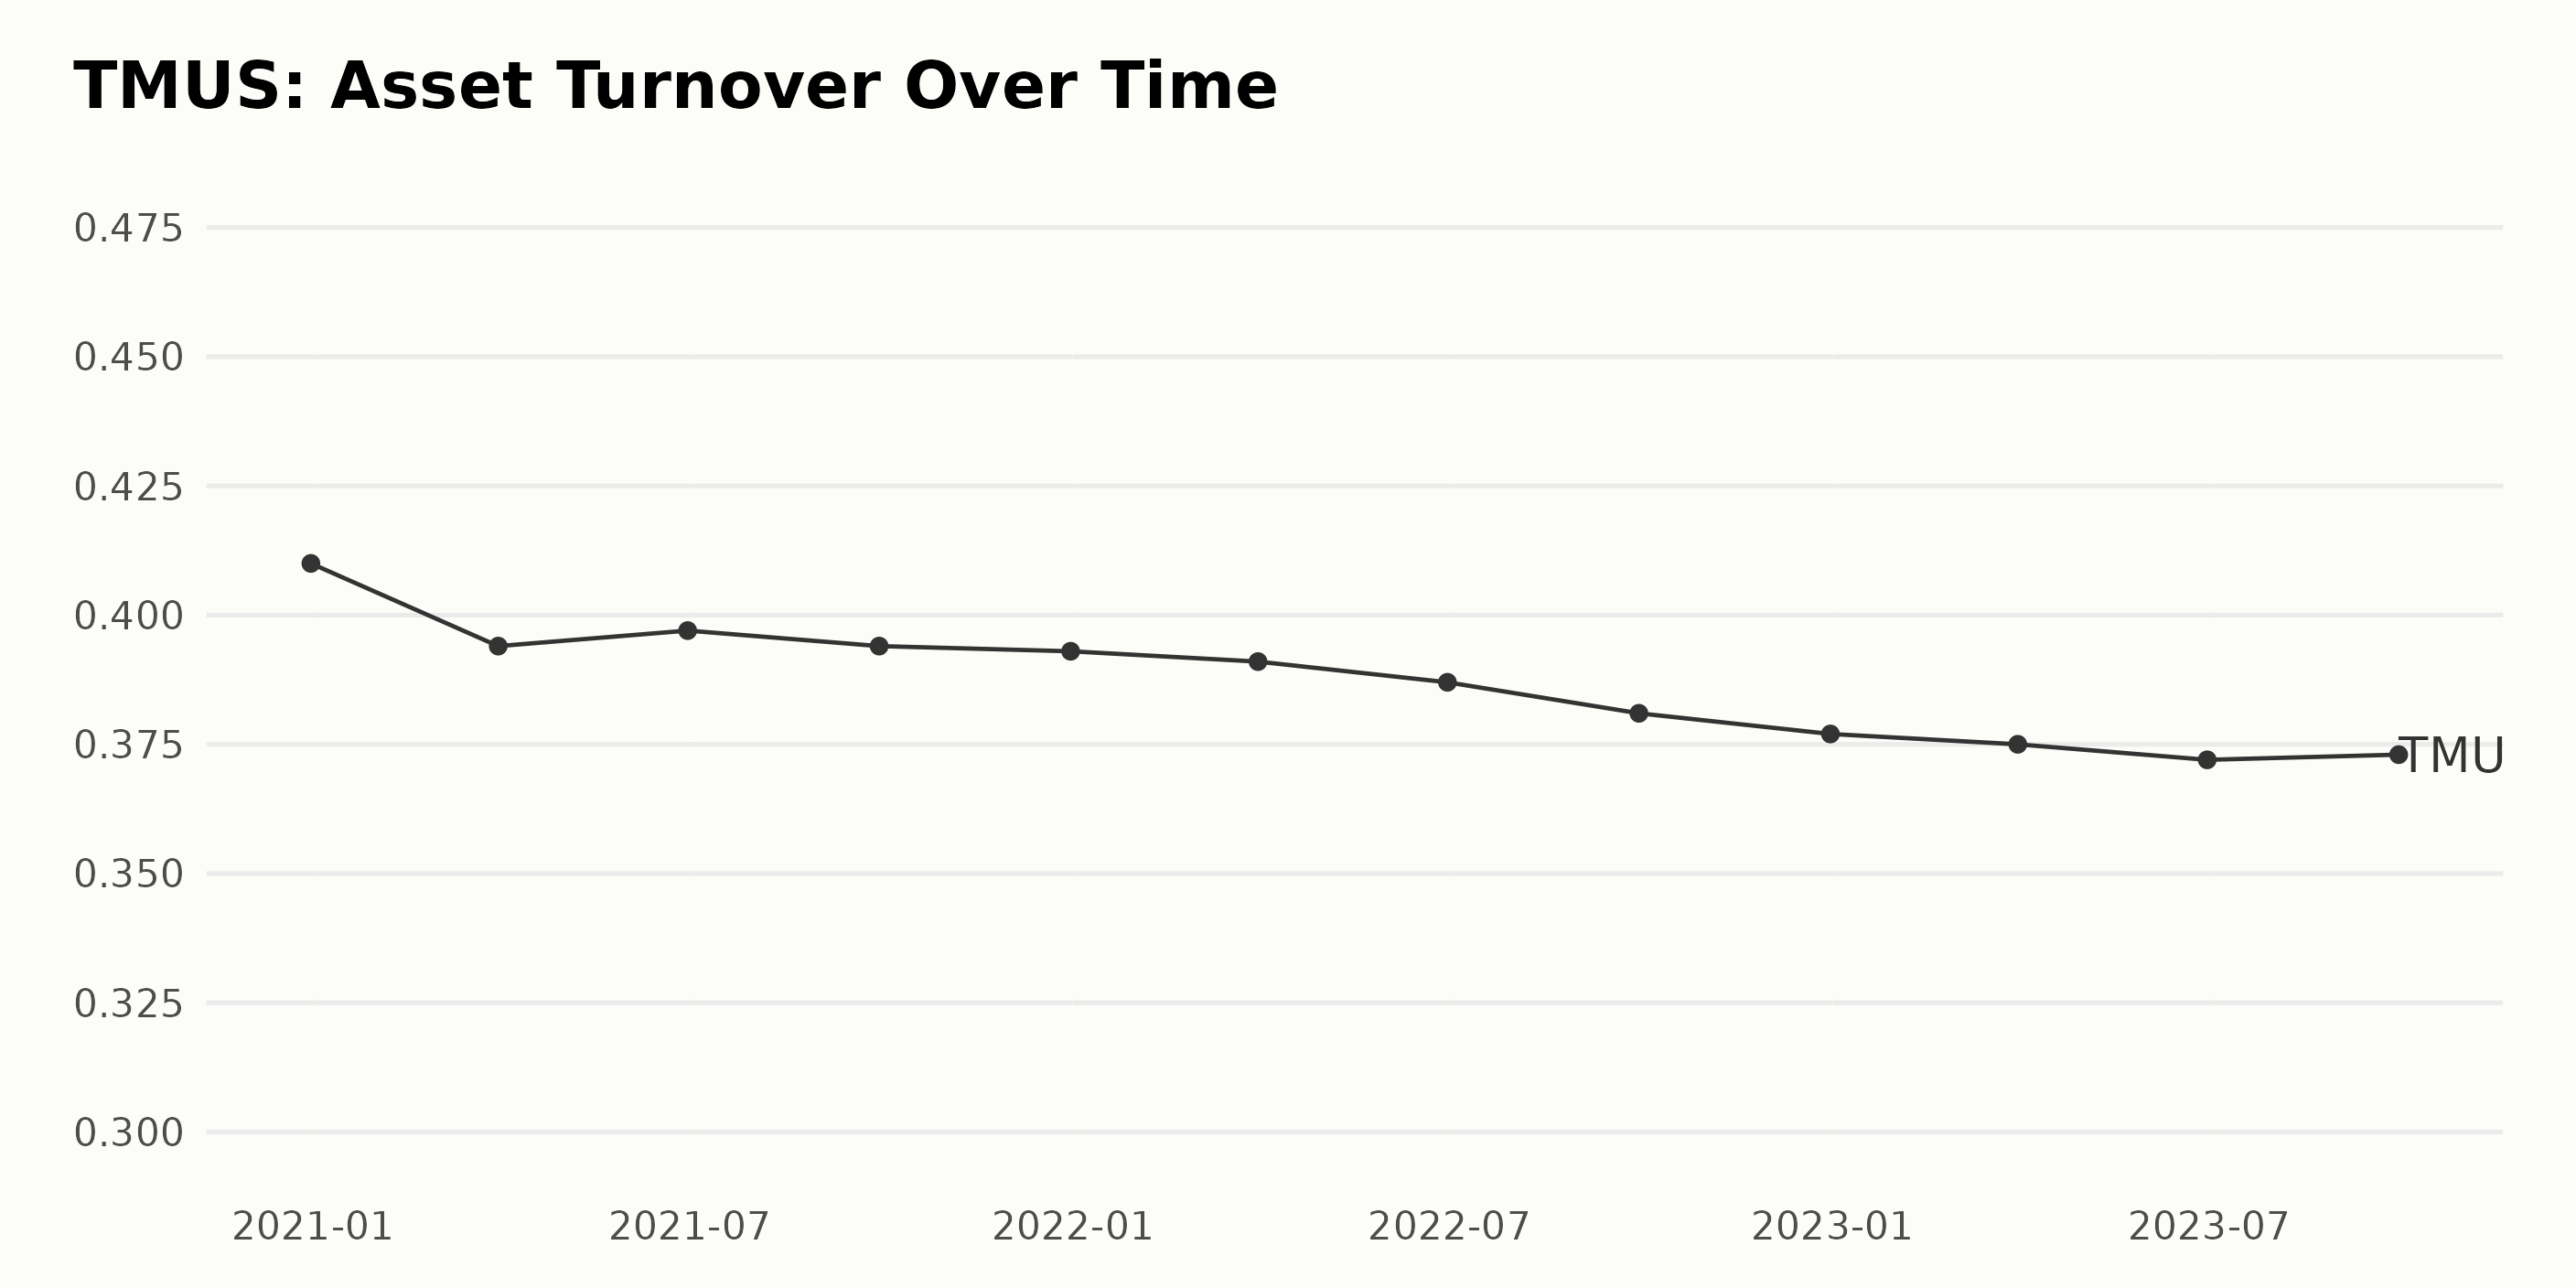
The Asset Turnover of TMUS displays a generally decreasing trend for the period between December 31, 2020, and September 30, 2023. Below are some specific observations regarding fluctuations and overall progression:
- Asset Turnover commenced at 0.41 as of December 31, 2020, and gradually decreased over time, with minor fluctuations, to a value of 0.373 by September 30, 2023.
- The year 2021 experienced slight yet consistent declines in Asset Turnover quarterly, from 0.394 in March down to 0.393 in December.
- The Asset Turnover saw a modest dip in 2022, beginning at 0.391 in March and dropping to 0.377 in December.
- In 2023, Asset Turnover continued on its downward trajectory from March's figure of 0.375, reaching a low of 0.372 in June before experiencing a slight uptick to 0.373 by September.
However, if we assess the overall growth rate from the first to the last value, we witness a decline in the Asset Turnover of about 9%. This indicates that for the given period, TMUS's ability to generate sales relative to its asset investment has somewhat declined.
Analyzing T-Mobile's Fairly Stable Six Month Stock Performance in 2023
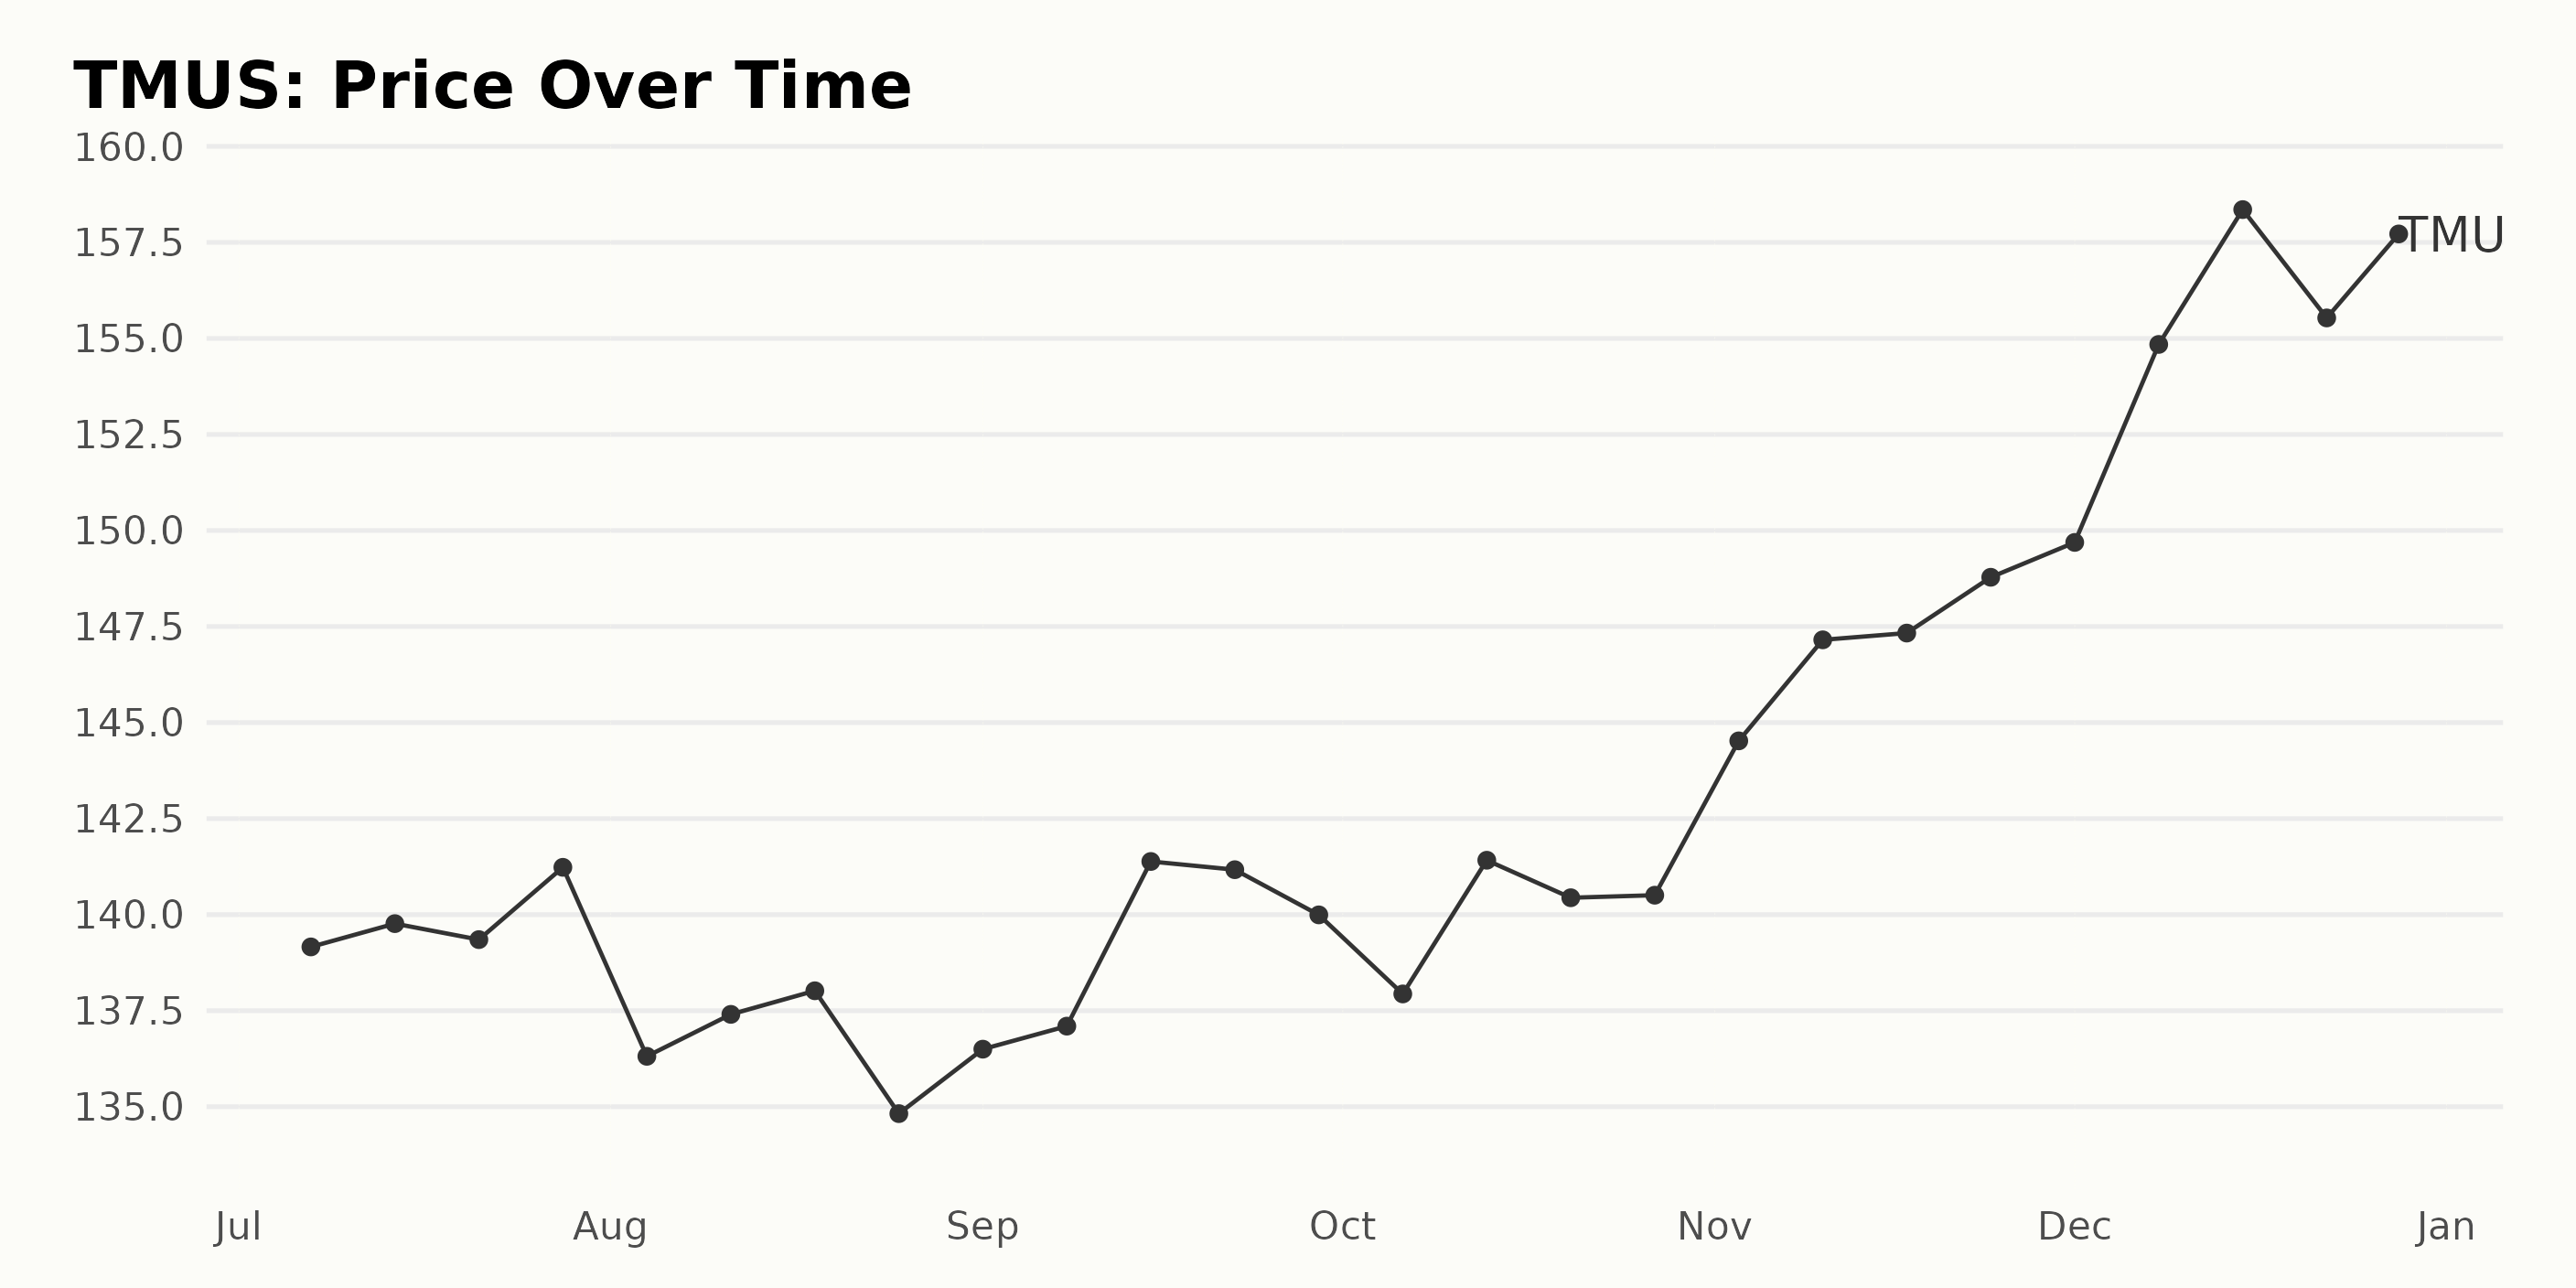
The share price of TMUS demonstrates variability and a generally upward trend from July to December 2023.
- In July 2023, the share price showed slight growth — starting at $139.16 on July 7, fluctuating, and finally landing at $141.23 by July 28.
- August 2023 saw some volatility with a decrease in shares, dropping from an initial $136.31 on August 4 to a low of $134.82 by August 25.
- September 2023 brought a modest rebound. The share price initially rose to a peak of $141.38 mid-month, but it decreased to $139.99 by month-end.
- October 2023 was mostly upward, with the stock closing at $140.50 on October 27.
- November introduced a notable increase, beginning at $144.52 on November 3 and peaking at $148.78 by November 24.
- December 2023 culminated in the highest share price for the six-month period. Starting the month at $149.69, the price noticeably escalated to reach a peak of $158.35 on December 15 before moderating slightly to close at $157.72 in the last session.
Overall, although there were periods of slight weakening, the general pattern demonstrated a gradual increase, indicative of healthy growth and acceleration for TMUS within this period. Here is a chart of TMUS's price over the past 180 days.
Assessing T-Mobile's Robust Performance Across Growth, Stability, and Quality Dimensions
TMUS has an overall C rating, translating to a Neutral in our POWR Ratings system. It is ranked #7 out of the 16 stocks in the Telecom - Domestic category.
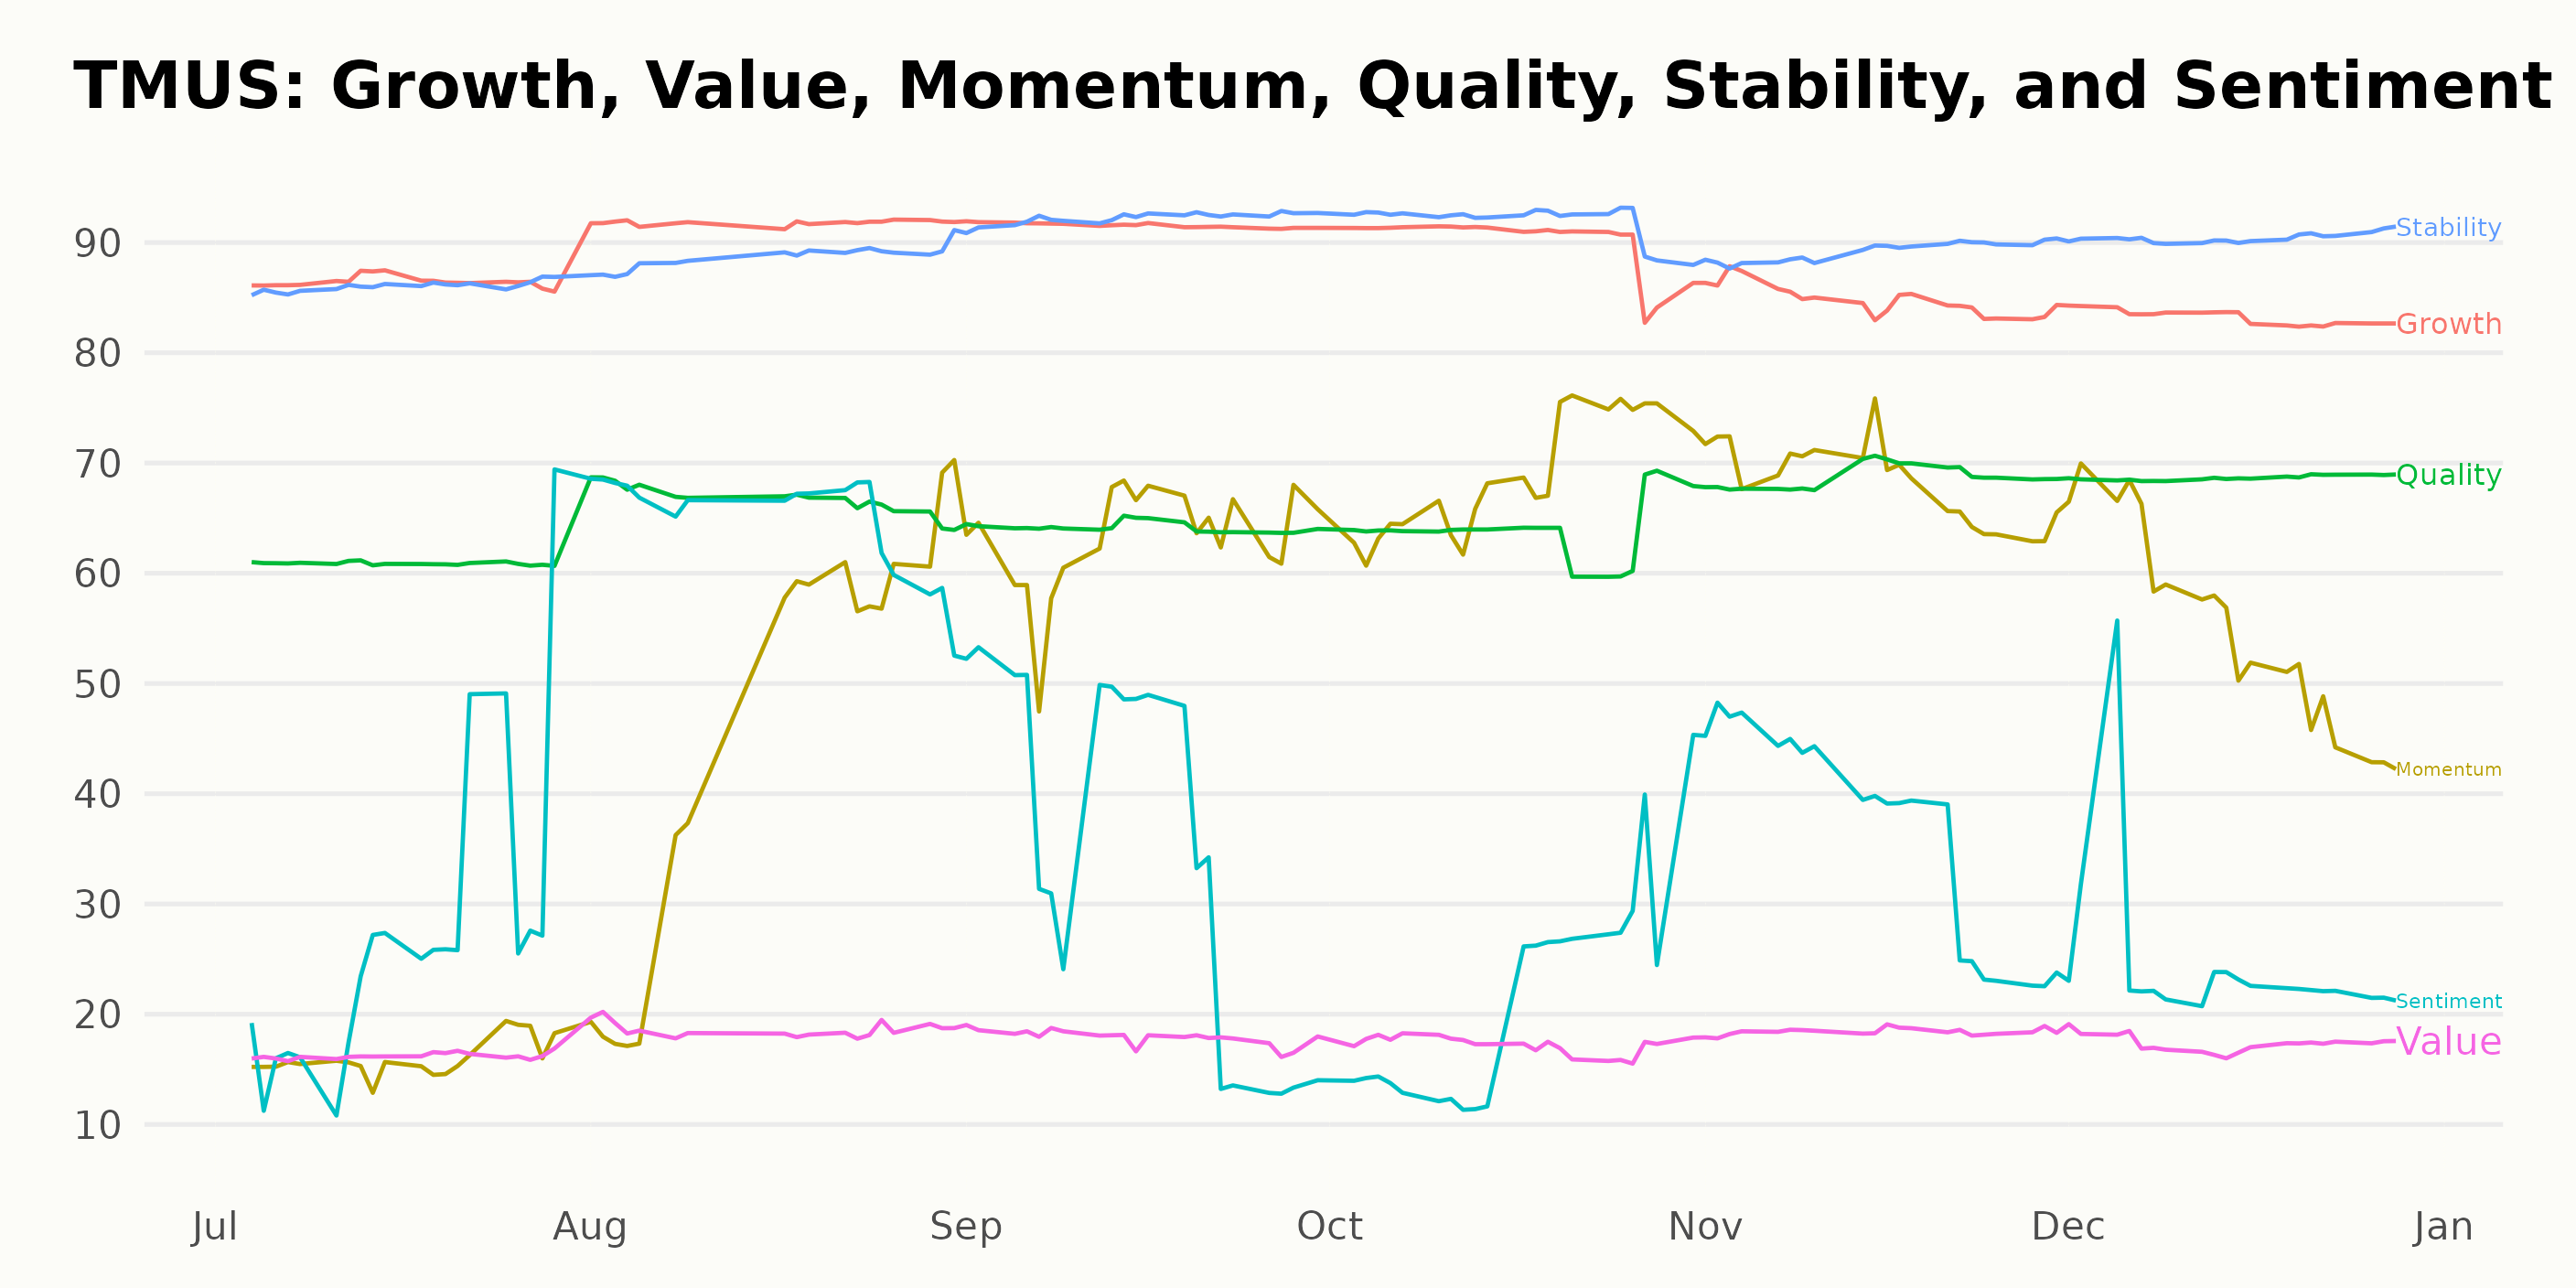
The POWR Ratings for T-Mobile US Inc. (TMUS) along 6 dimensions provide important insights. Considering the three most noteworthy POWR dimensions for TMUS, the consistently highest ratings were observed in 'Growth', 'Stability', and 'Quality'.
Growth: The Growth dimension has consistently high ratings over the timeline. The score peaked at 92 in August and September 2023, slightly dipped to 90 in October, 85 in November, and finally settled at 83 by December 2023.
Stability: The Stability dimension also showcased impressive ratings. The ratings slightly increased from 86 in July 2023 to a peak of 92 in September and October 2023. Afterwards, the ratings saw a slightly operator to 89 in November and increased back to 90 by the end of December 2023.
Quality: The Quality dimension had a consistent upward trend throughout the given timeline. Starting with a score of 61 in July 2023, it gradually increased to reach its highest point of 69 in November and December 2023. It's worth noting that all three dimensions maintained a rating of more than 80 through the majority of the timeline, signalling a robust performance by TMUS across these key areas.
How does T-Mobile US Inc. (TMUS) Stack Up Against its Peers?
Other stocks in the Telecom - Domestic sector that may be worth considering are Spok Holdings, Inc. (SPOK), InterDigital Inc. (IDCC), and Ooma Inc. (OOMA) -- they have better POWR Ratings.
What To Do Next?
Discover 10 widely held stocks that our proprietary model shows have tremendous downside potential. Please make sure none of these “death trap” stocks are lurking in your portfolio:
TMUS shares were trading at $160.70 per share on Friday afternoon, up $1.75 (+1.10%). Year-to-date, TMUS has gained 15.29%, versus a 26.14% rise in the benchmark S&P 500 index during the same period.
About the Author: Subhasree Kar

Subhasree’s keen interest in financial instruments led her to pursue a career as an investment analyst. After earning a Master’s degree in Economics, she gained knowledge of equity research and portfolio management at Finlatics.
The post T-Mobile (TMUS) December Surge: Buy or Hold? appeared first on StockNews.com