In October, headline retail sales marked their first monthly decline since March. However, the 0.1% drop was less than the 0.3% decline that analysts had expected, underscoring that the U.S. consumer is in much better shape than what economists have projected.
Against this backdrop, discount variety retailer Dollar Tree, Inc. (DLTR) reported its third-quarter results last week. The company’s revenue was $7.31 billion, missing the Wall Street analyst estimate of $7.42 billion. Moreover, DLTR reported an adjusted EPS of $0.97 for the quarter, missing the analyst estimate of $1.01.
On the other hand, the company’s same-store net sales increased by 3.9%, driven by a 4.7% increase in traffic and partially offset by a 0.8% decline in average tickets. Therefore, let’s look at the trends of DLTR’s key financial metrics to understand why it could be wise to watch and wait for an opportune entry point in the stock.
Dollar Tree, Inc.: A Detailed Analysis of Key Financials from 2021 to 2023
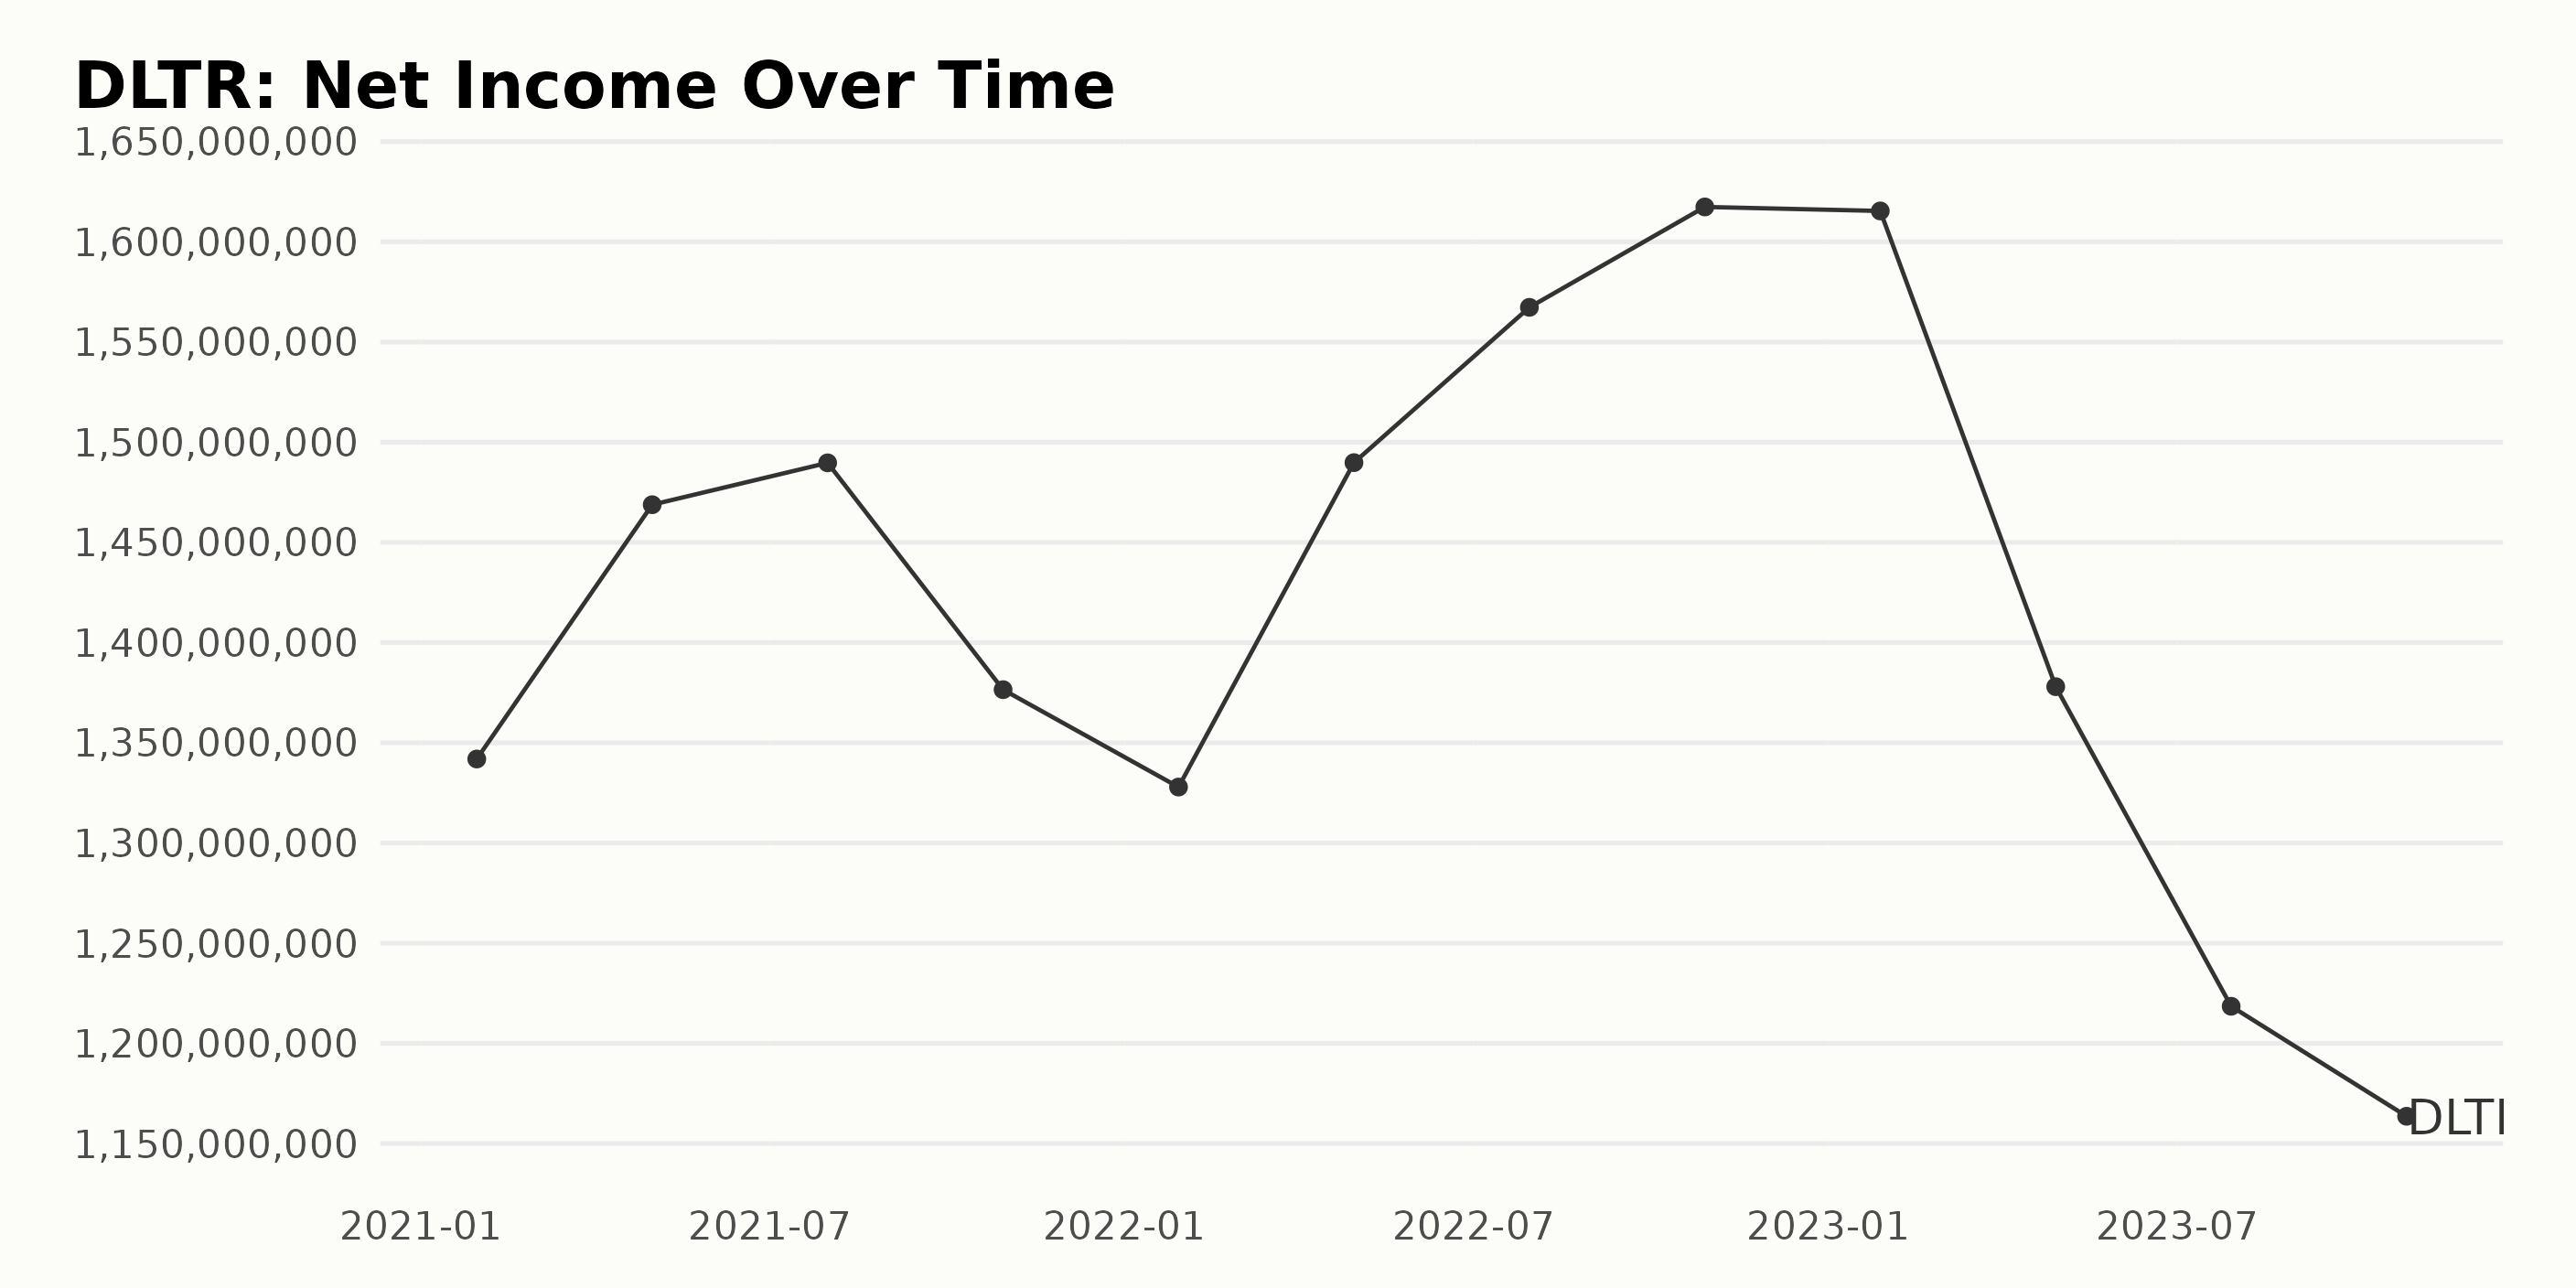
The trailing-12-month net income of DLTR seems to have experienced a general upward trend with intermittent fluctuations over the observed time period, starting from January 2021 and ending in October 2023:
- In January 2021, DLTR reported a net income of $1.34 billion.
- By May 2021, the net income had increased slightly to $1.47 billion.
- A steady uptick occurred through July 2022, peaking at $1.62 billion in October 2022.
- However, a downward trend occurred throughout 2023, falling to $1.16 billion by October 2023.
- To focus on the most recent data, as of October 2023, the net income value stands at $1.16 billion. This figure represents a decrease from its peak at $1.62 billion in October 2022 but is still higher than the initial value of $1.34 billion in January 2021.
To perform a simple growth calculation, the net income at the start of the series in January 2021 was $1.34 billion, while the last reported value in October 2023 was $1.16 billion. This represents an approximate decrease of 13% over the reported period, indicating a negative growth despite the initial upward trajectory.
In conclusion, DLTR demonstrated an overall growth in net income during the first phase of the observed period with some fluctuations, followed by a downturn in the last year.
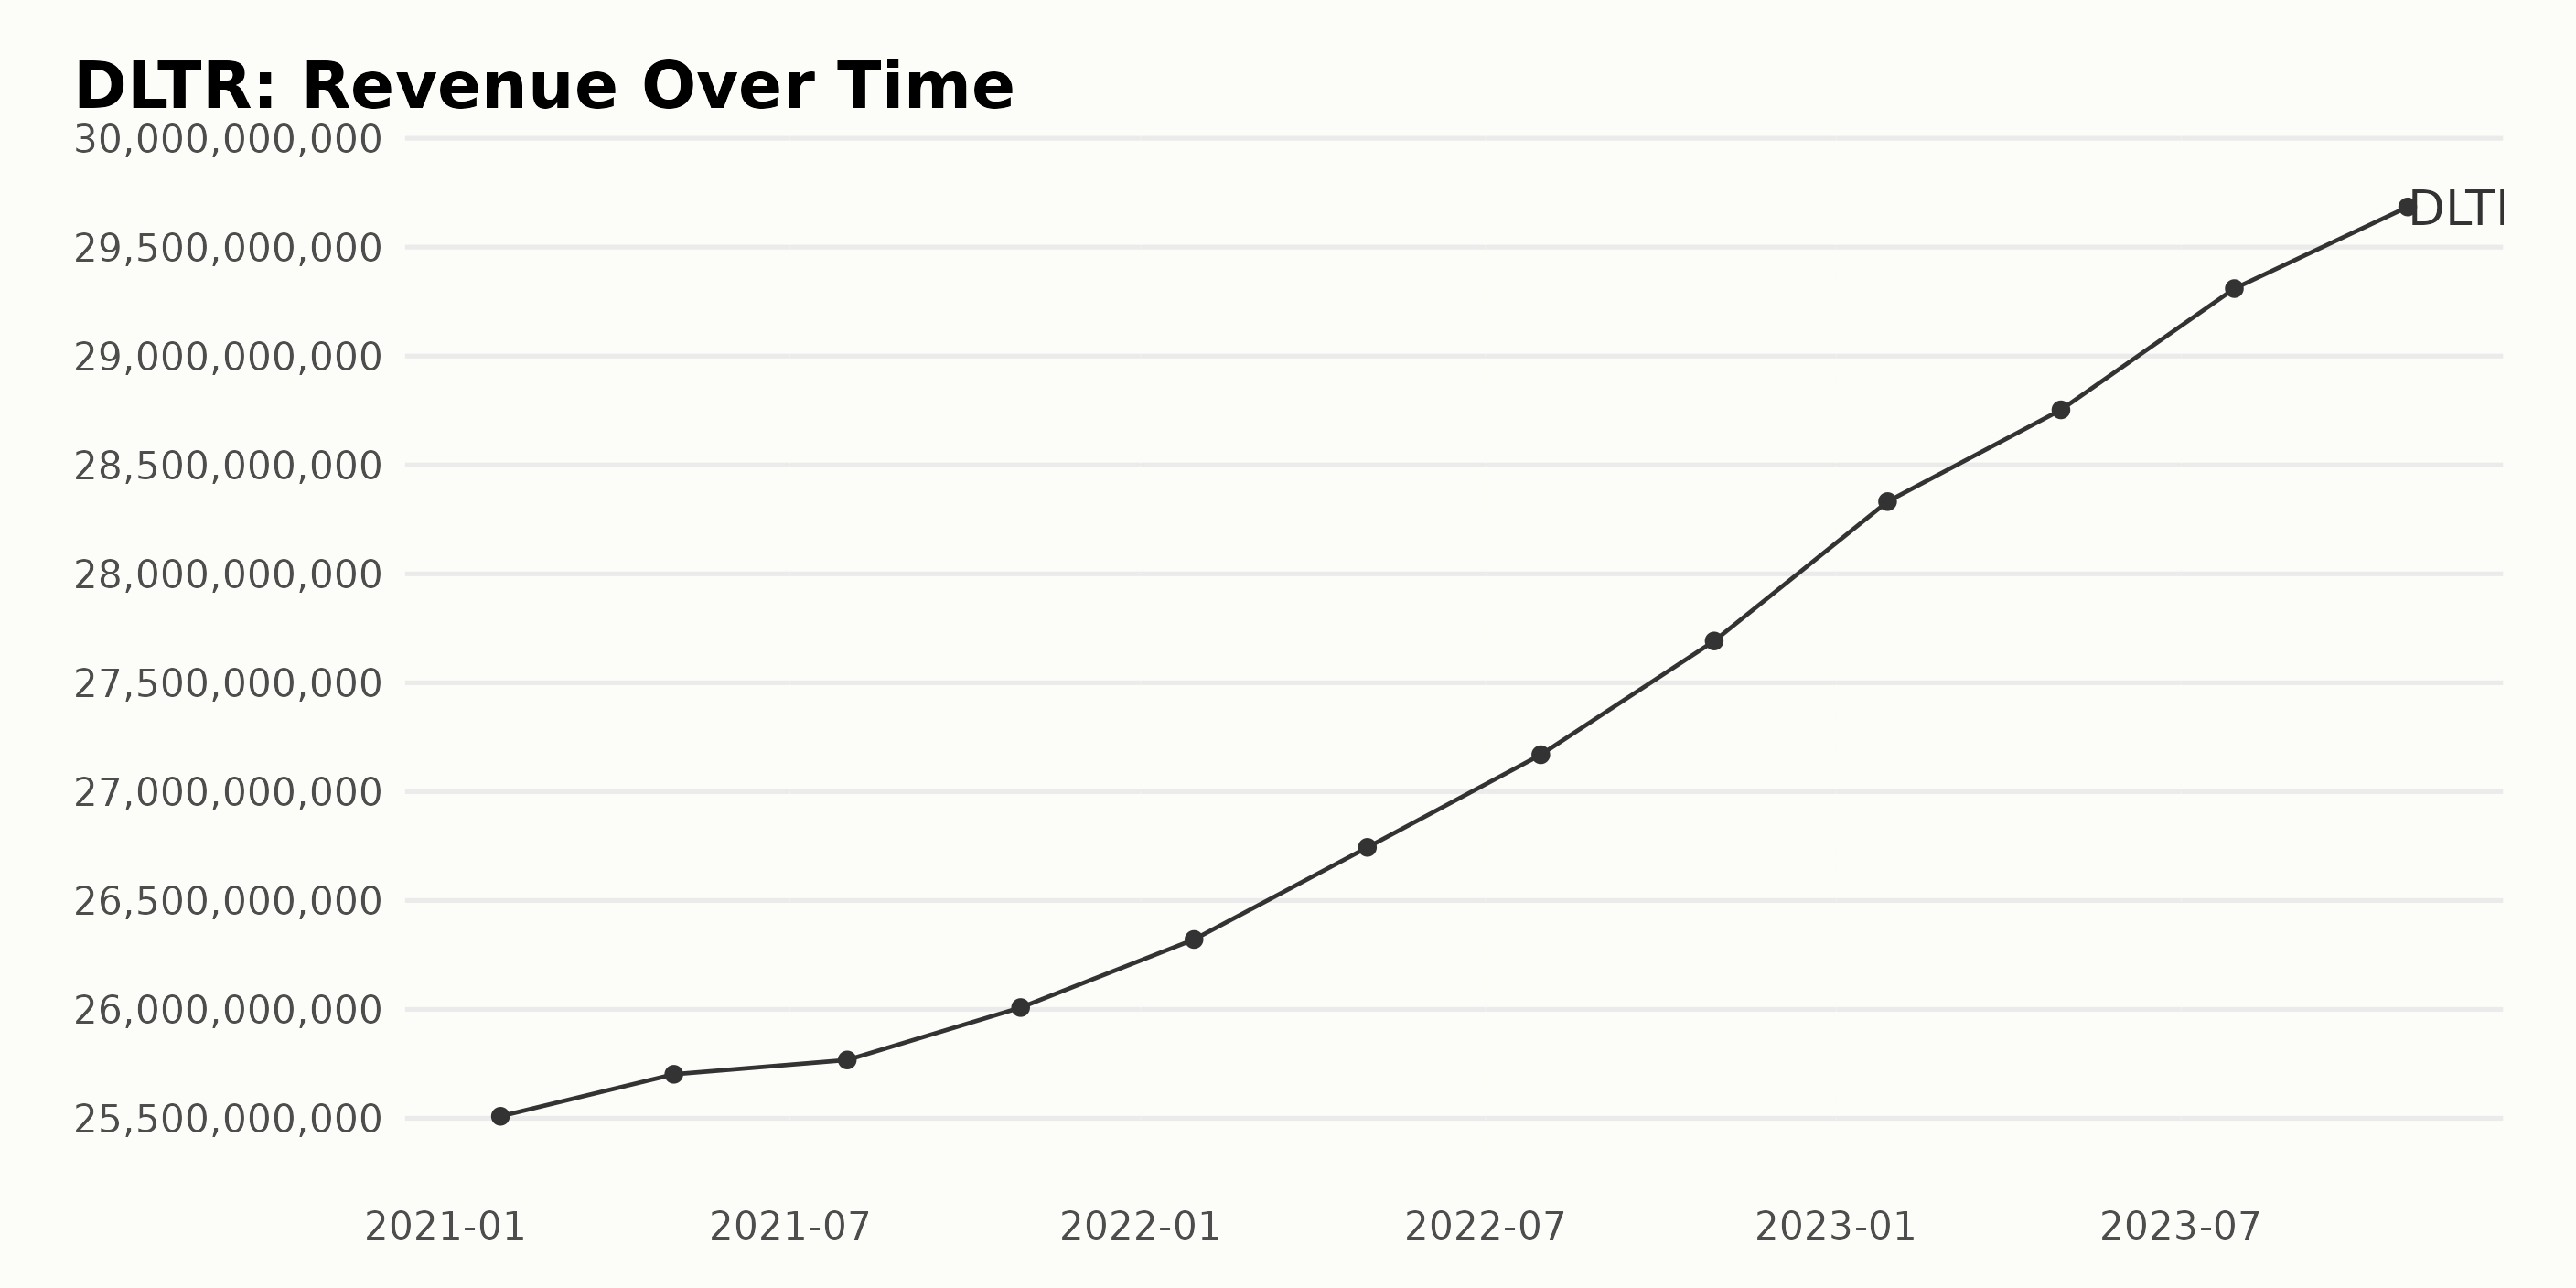
The trailing-12-month revenue trend of DLTR has shown an overall steady increase over the years from January 2021 to October 2023. The analysis below outlines the fluctuations and growth:
- January 2021: Revenue started at $25.51 billion.
- May 2021: A slight increase was observed with revenue at $25.70 billion.
- July 2021: Minimal growth continued, reaching $25.77 billion in revenue.
- January 2022: A noticeable increase in revenue was seen at $26.32 billion.
- July 2022: Further progressive growth marked by revenue at $27.17 billion.
- October 2022: Continued rise in revenue saw it stand at $27.69 billion.
- January 2023: A notable increase in revenue was observed at $28.33 billion.
- July 2023: Revenue grew significantly, reaching $29.31 billion.
- October 2023: The data series ended with a maximum revenue figure of $29.68 billion.
The revenue recorded an overall growth of approximately $4.17 billion, signifying a growth rate of 16.3% from January 2021 to October 2023. More emphasis should be placed on the uptrend noted in recent data, particularly the notable jumps in revenue from 2022 onwards, which increased at a faster pace than the preceding year. This suggests positive financial performance for DLTR within this timeframe.
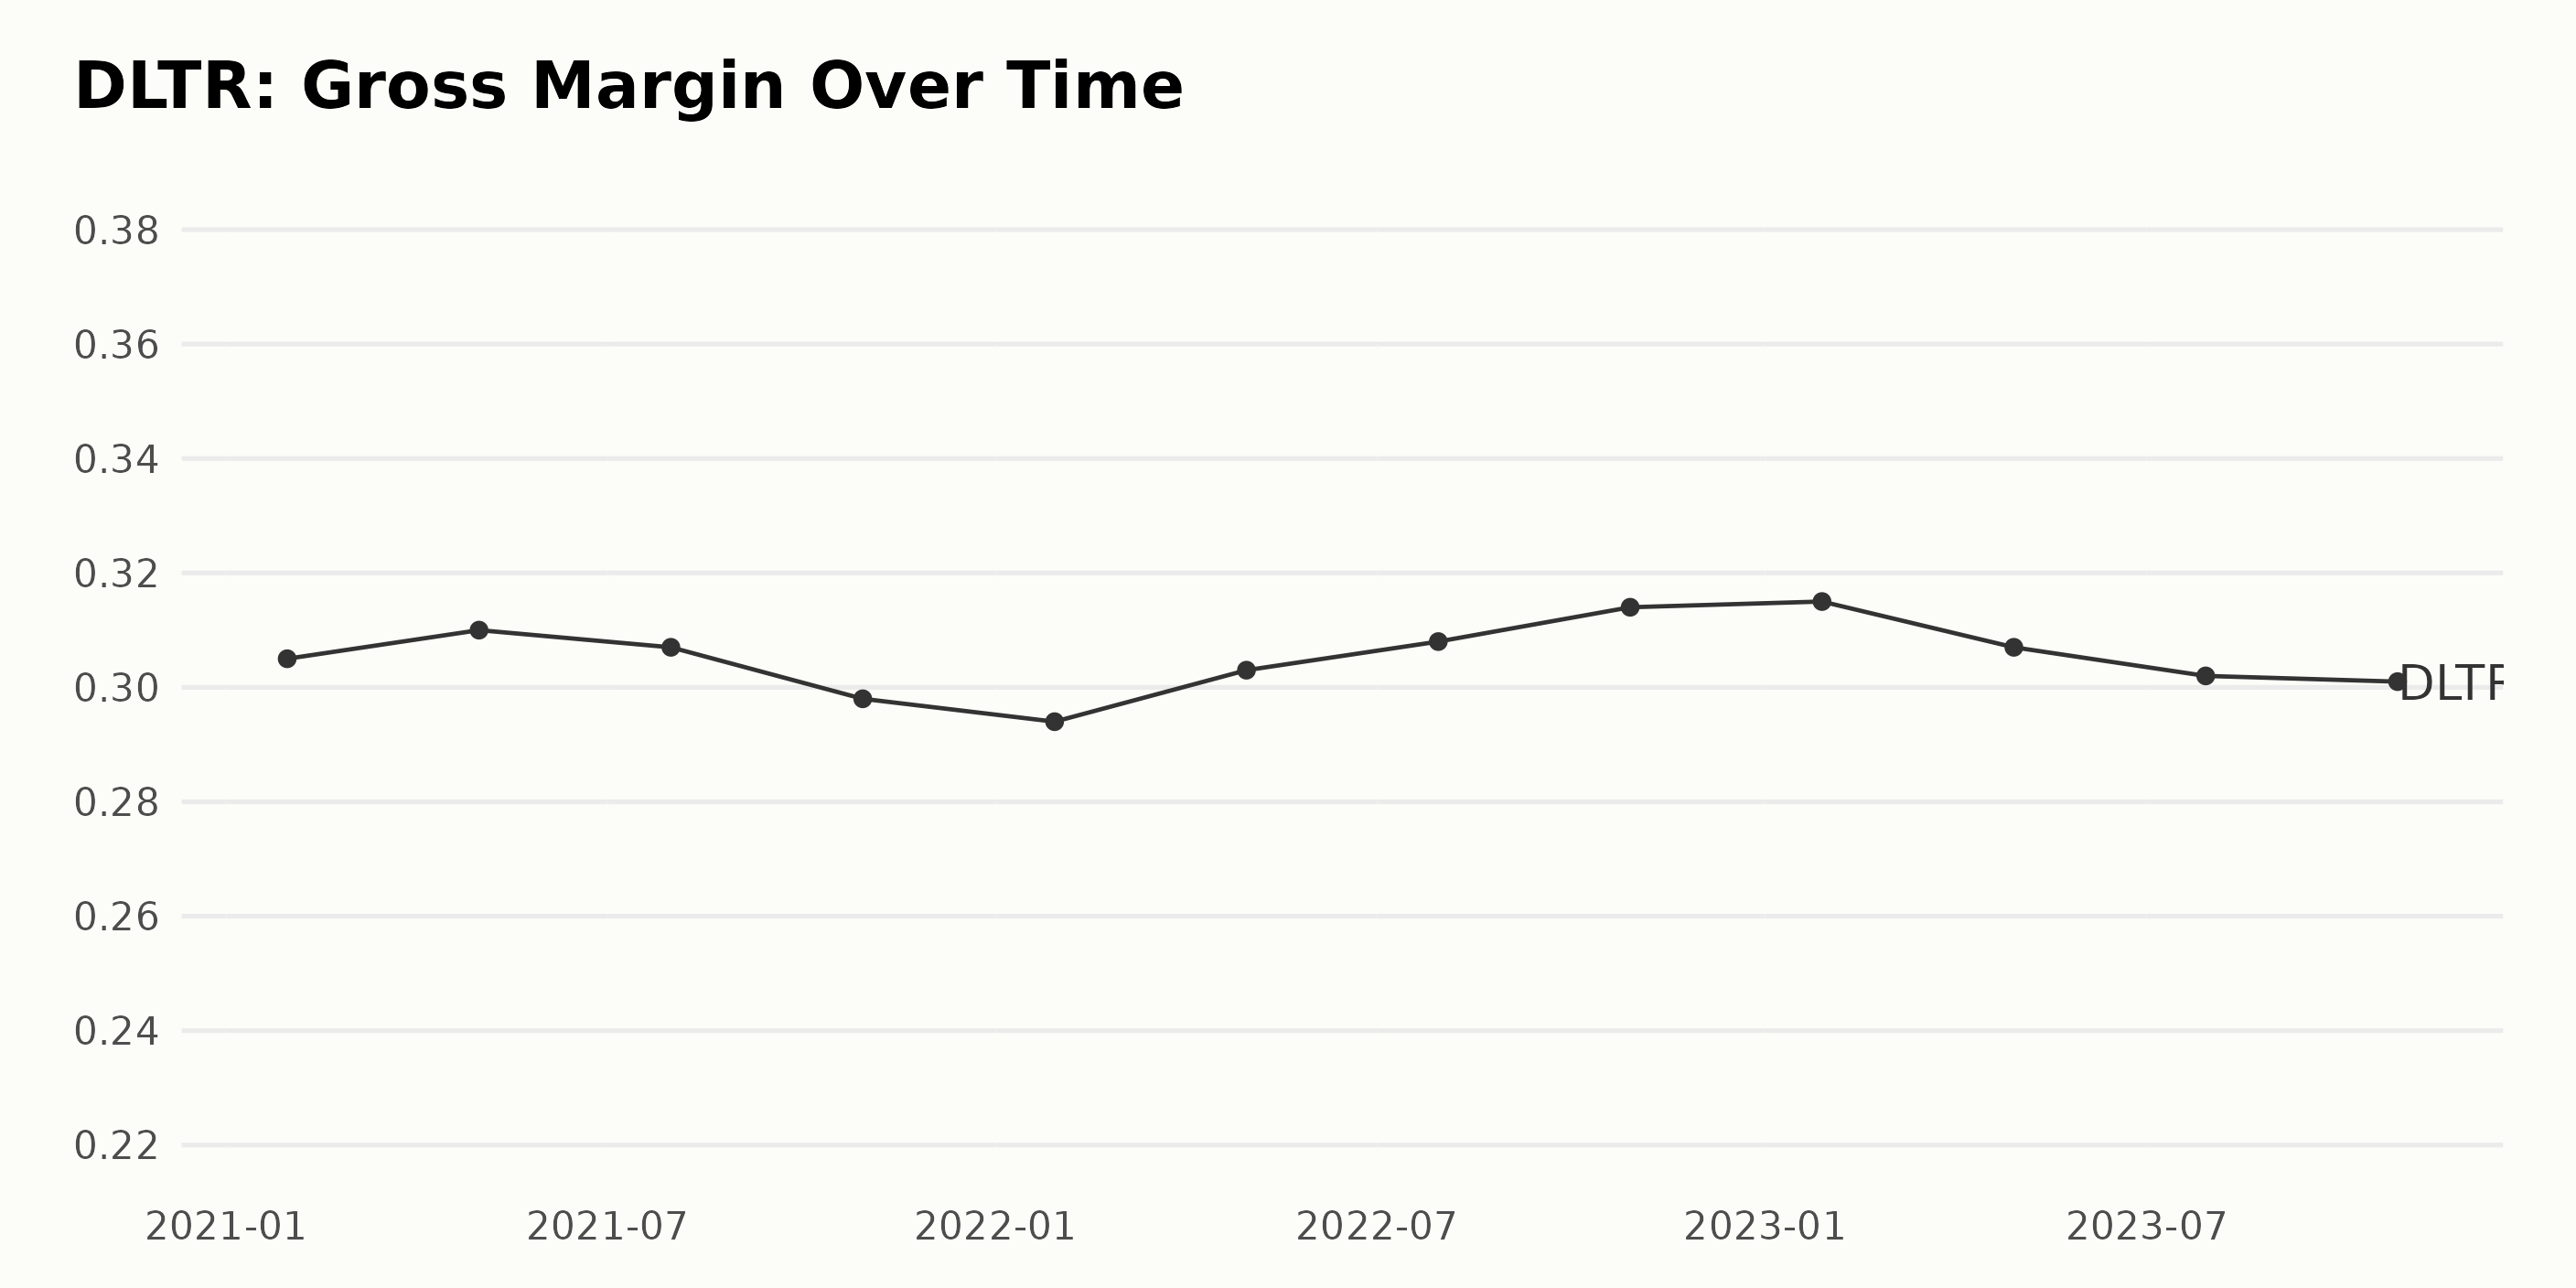
The following is a summary of the gross margin reported by DLTR from January 2021 to October 2023:
- January, 2021: 30.5%
- May, 2021: 31.0%
- July, 2021: 30.7%
- October, 2021: 29.8%
- January, 2022: 29.4%
- April, 2022: 30.3%
- July, 2022: 30.8%
- October, 2022: 31.4%
- January, 2023: 31.5%
- April, 2023: 30.7%
- July, 2023: 30.2%
- October, 2023: 30.1%
Starting at 30.5% in January 2021, the gross margin experienced slight fluctuations throughout the period, reaching its peak in January 2023 at 31.5%. However, the first and last values registered a meager variation, with an overall decrement of 0.4% between January 2021 and October 2023.
In more recent times, there has been a downward trend from the peak of January 2023, with a decrease of 1.4% to 30.1% in October 2023. In particular, the most recent value in October 2023 is slightly lower than it was two years prior, suggesting a modest contraction during this period.
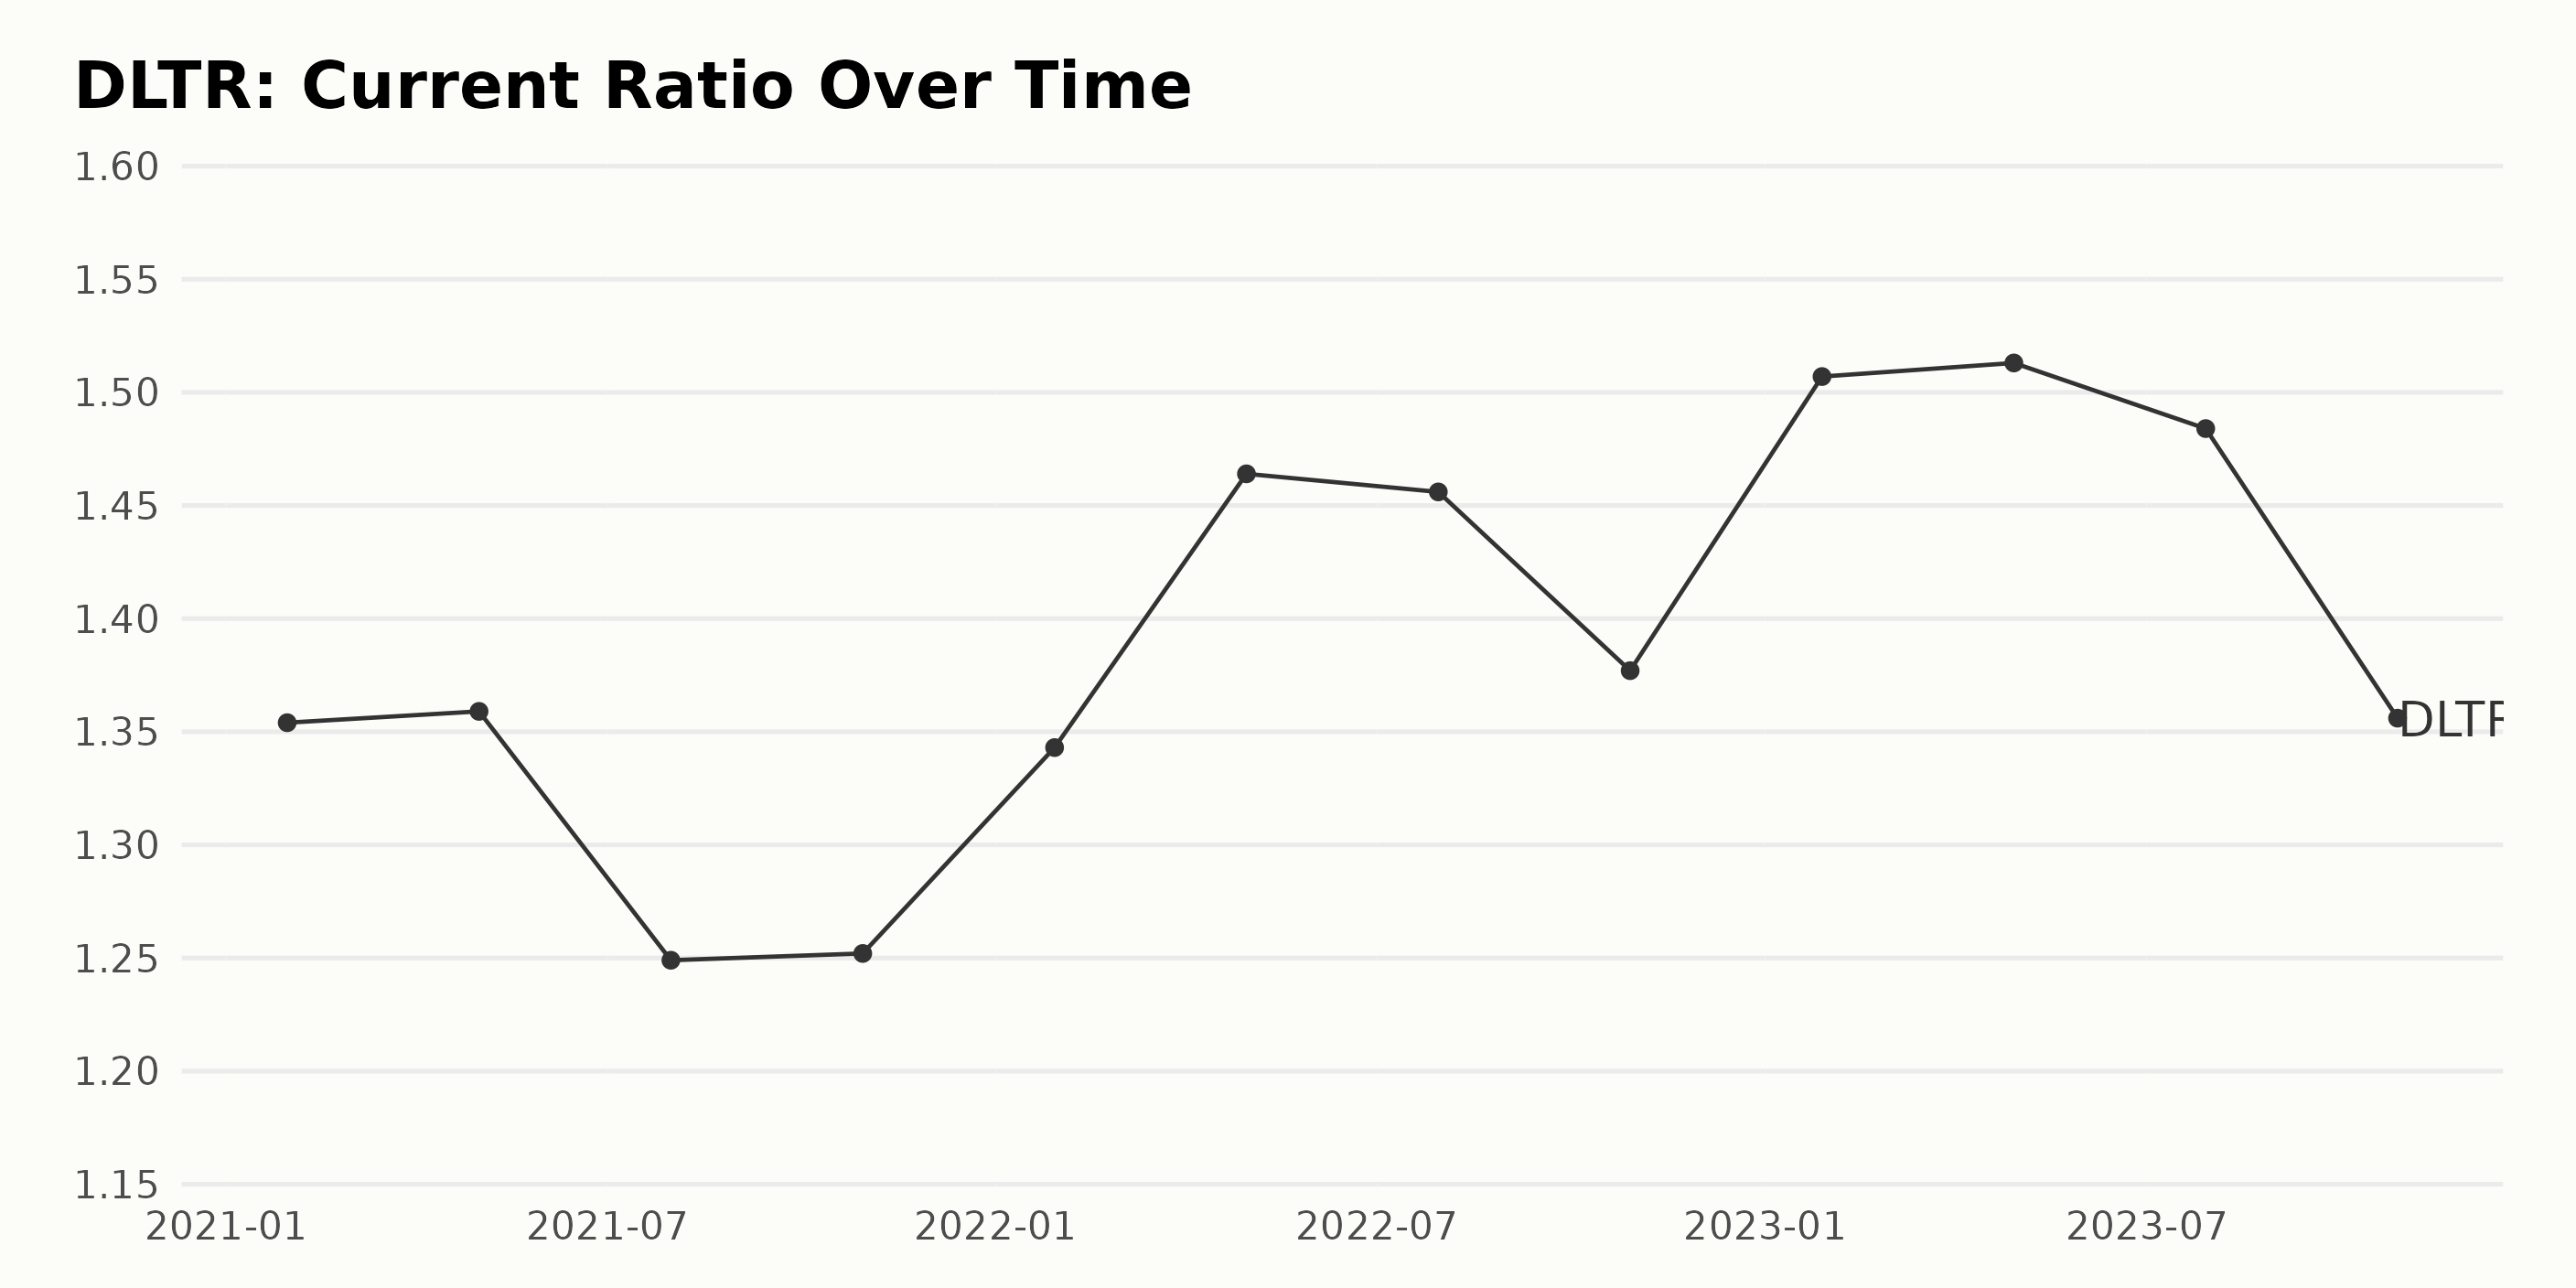
The current ratio of DLTR demonstrated several fluctuations over the period from January 2021 to October 2023.
- In January 2021, the ratio was 1.35.
- It then rose slightly to 1.36 by May 2021 but fell to 1.25 by July 2021.
- The ratio then remained stable at around 1.25 until January 2022, when it climbed up again to reach the value of 1.34.
- The highest current ratio was observed in April and May 2023, at 1.51.
- However, by October of the same year, it had decreased to 1.36, marking a marginal growth of approximately 0.74% since the beginning of the recorded period in January 2021.
Most recently, as of October 2023, DLTR's current ratio sits at 1.36. This number manifests slight growth compared to the start of the recording period (January 2021). However, looking at the overall trend through these years, DLTR's current ratio has seen both peaks and valleys, showing a certain level of volatility.
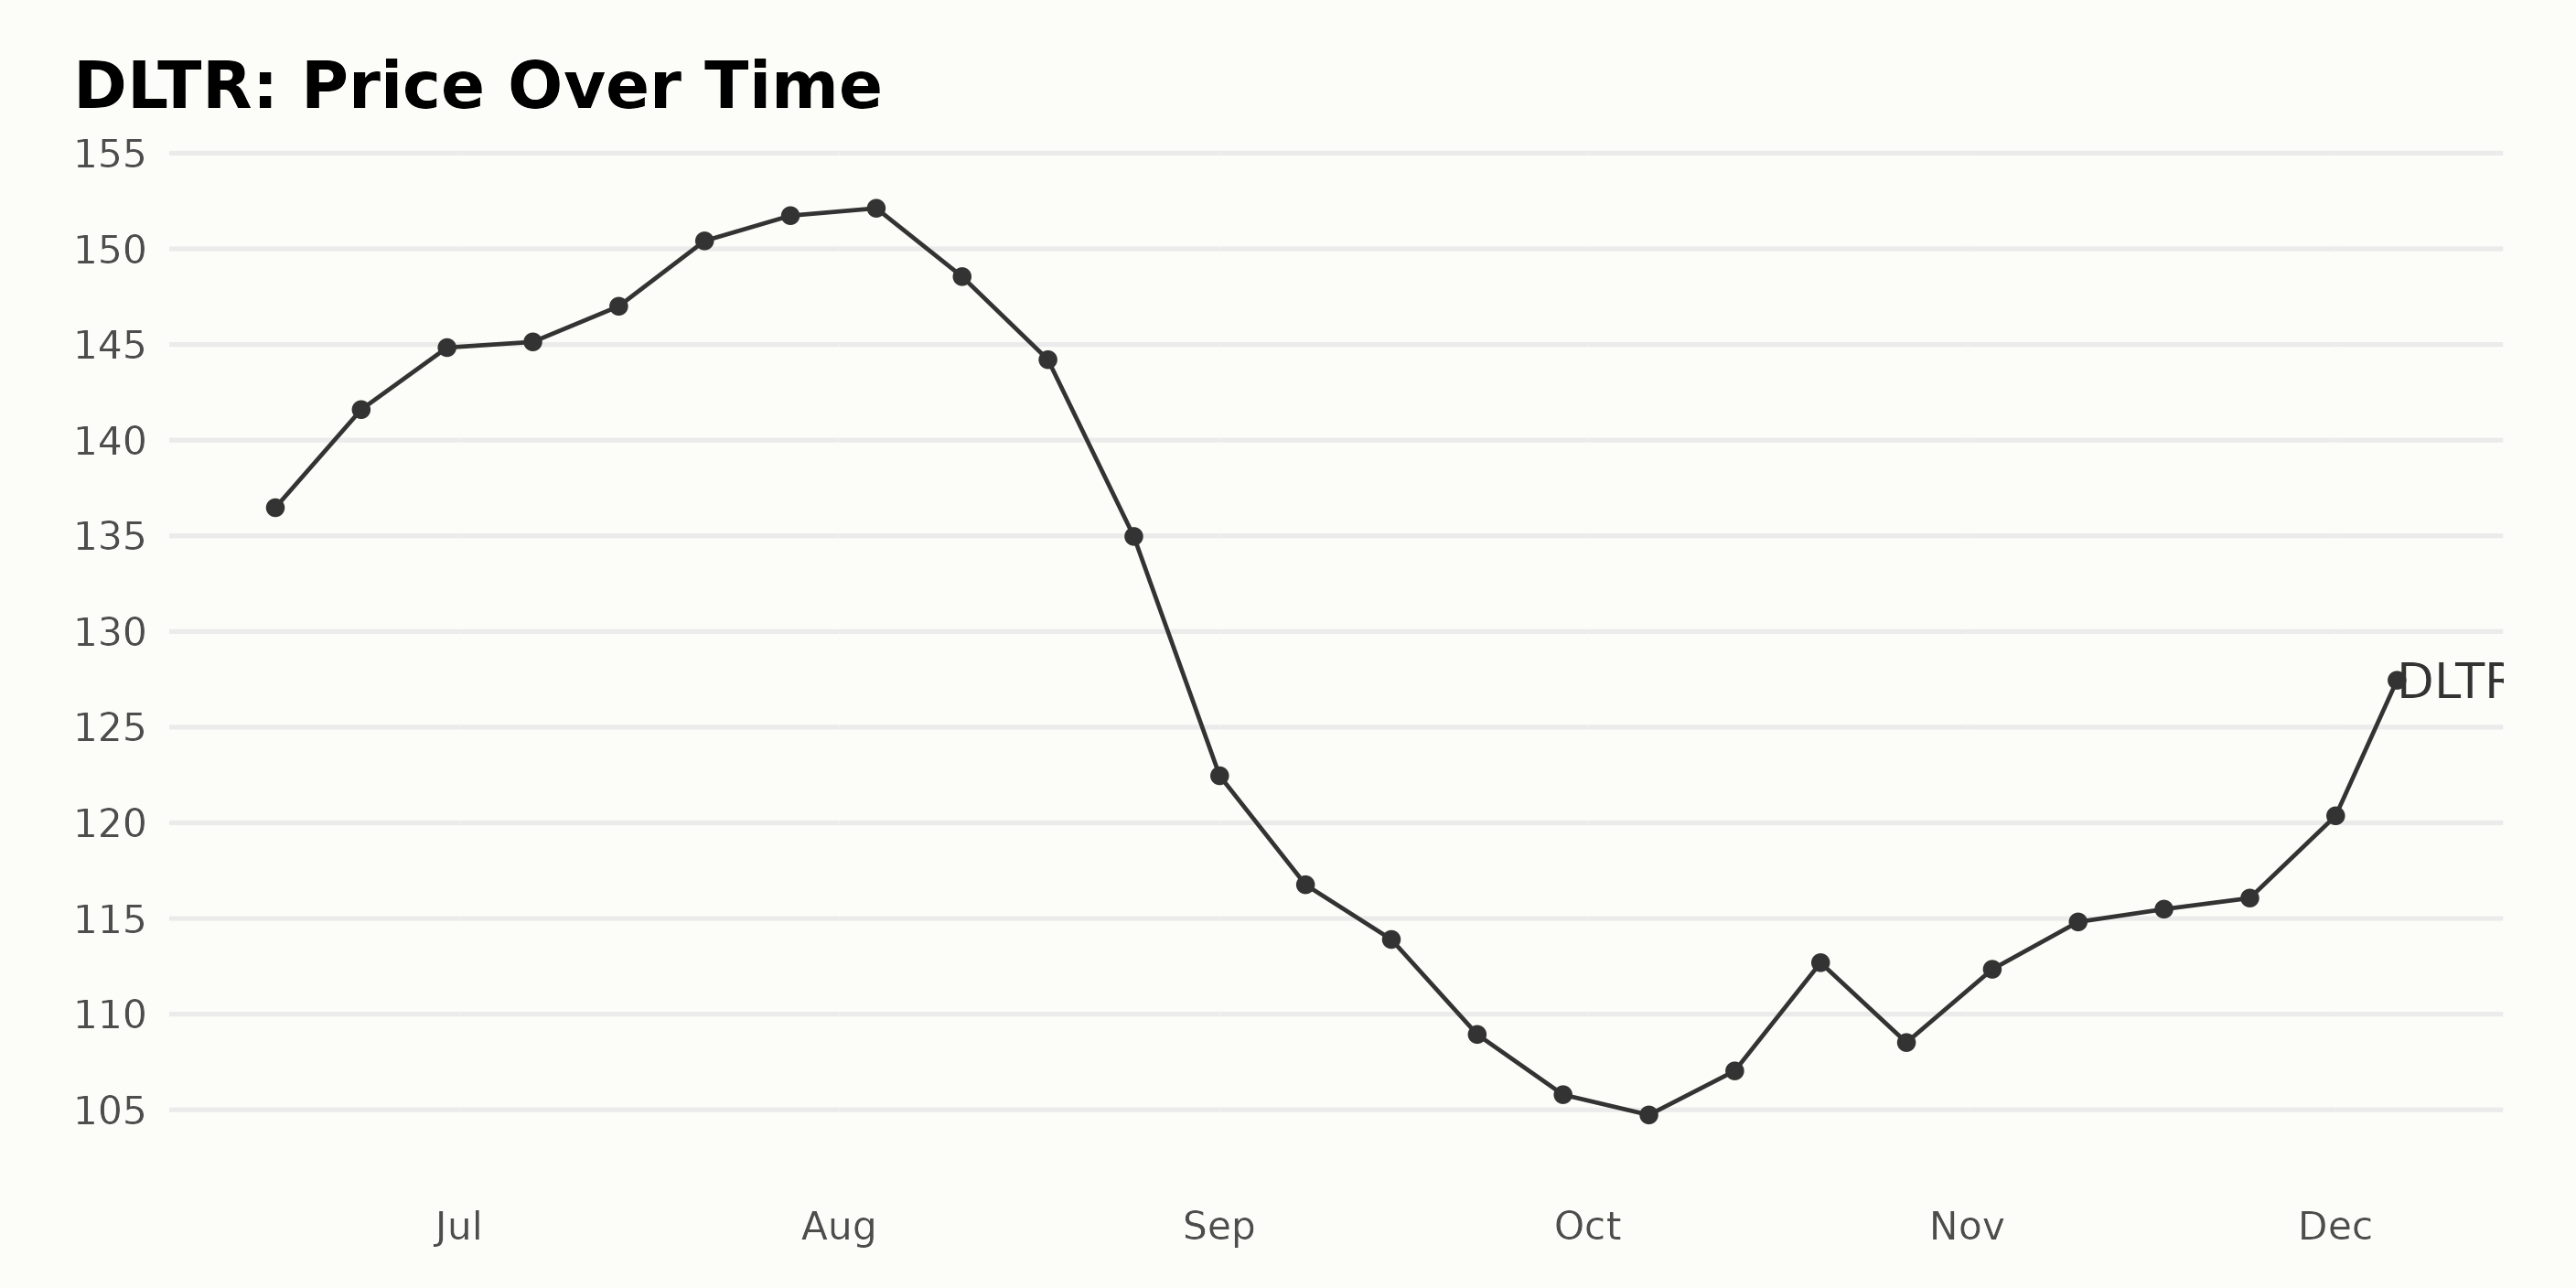
Analyzing Dollar Tree, Inc.'s Share Price Fluctuations: June to December 2023
The data shows a fluctuating growth rate of the share price for DLTR between June 2023 and December 2023. Here are some significant milestones from the data:
- On June 16, 2023, the share price was $136.47.
- There was a steady increase in the price over the next month, peaking at $152.12 on August 4, 2023.
- A decelerating trend appeared from August to September 2023, with the share price falling to $105.79 by September 29, 2023.
- Despite brief recoveries in October and November, the trend was largely inconsistent.
- However, by December 1, 2023, the share price rebounded to $120.37, eventually reaching $126.03 by December 6, 2023.
Overall, the trend for this period shows initial growth, a significant decrease, followed by a somewhat inconsistent recovery. These fluctuations and inconsistencies indicate the presence of volatility within this timeframe. Here is a chart of DLTR's price over the past 180 days.
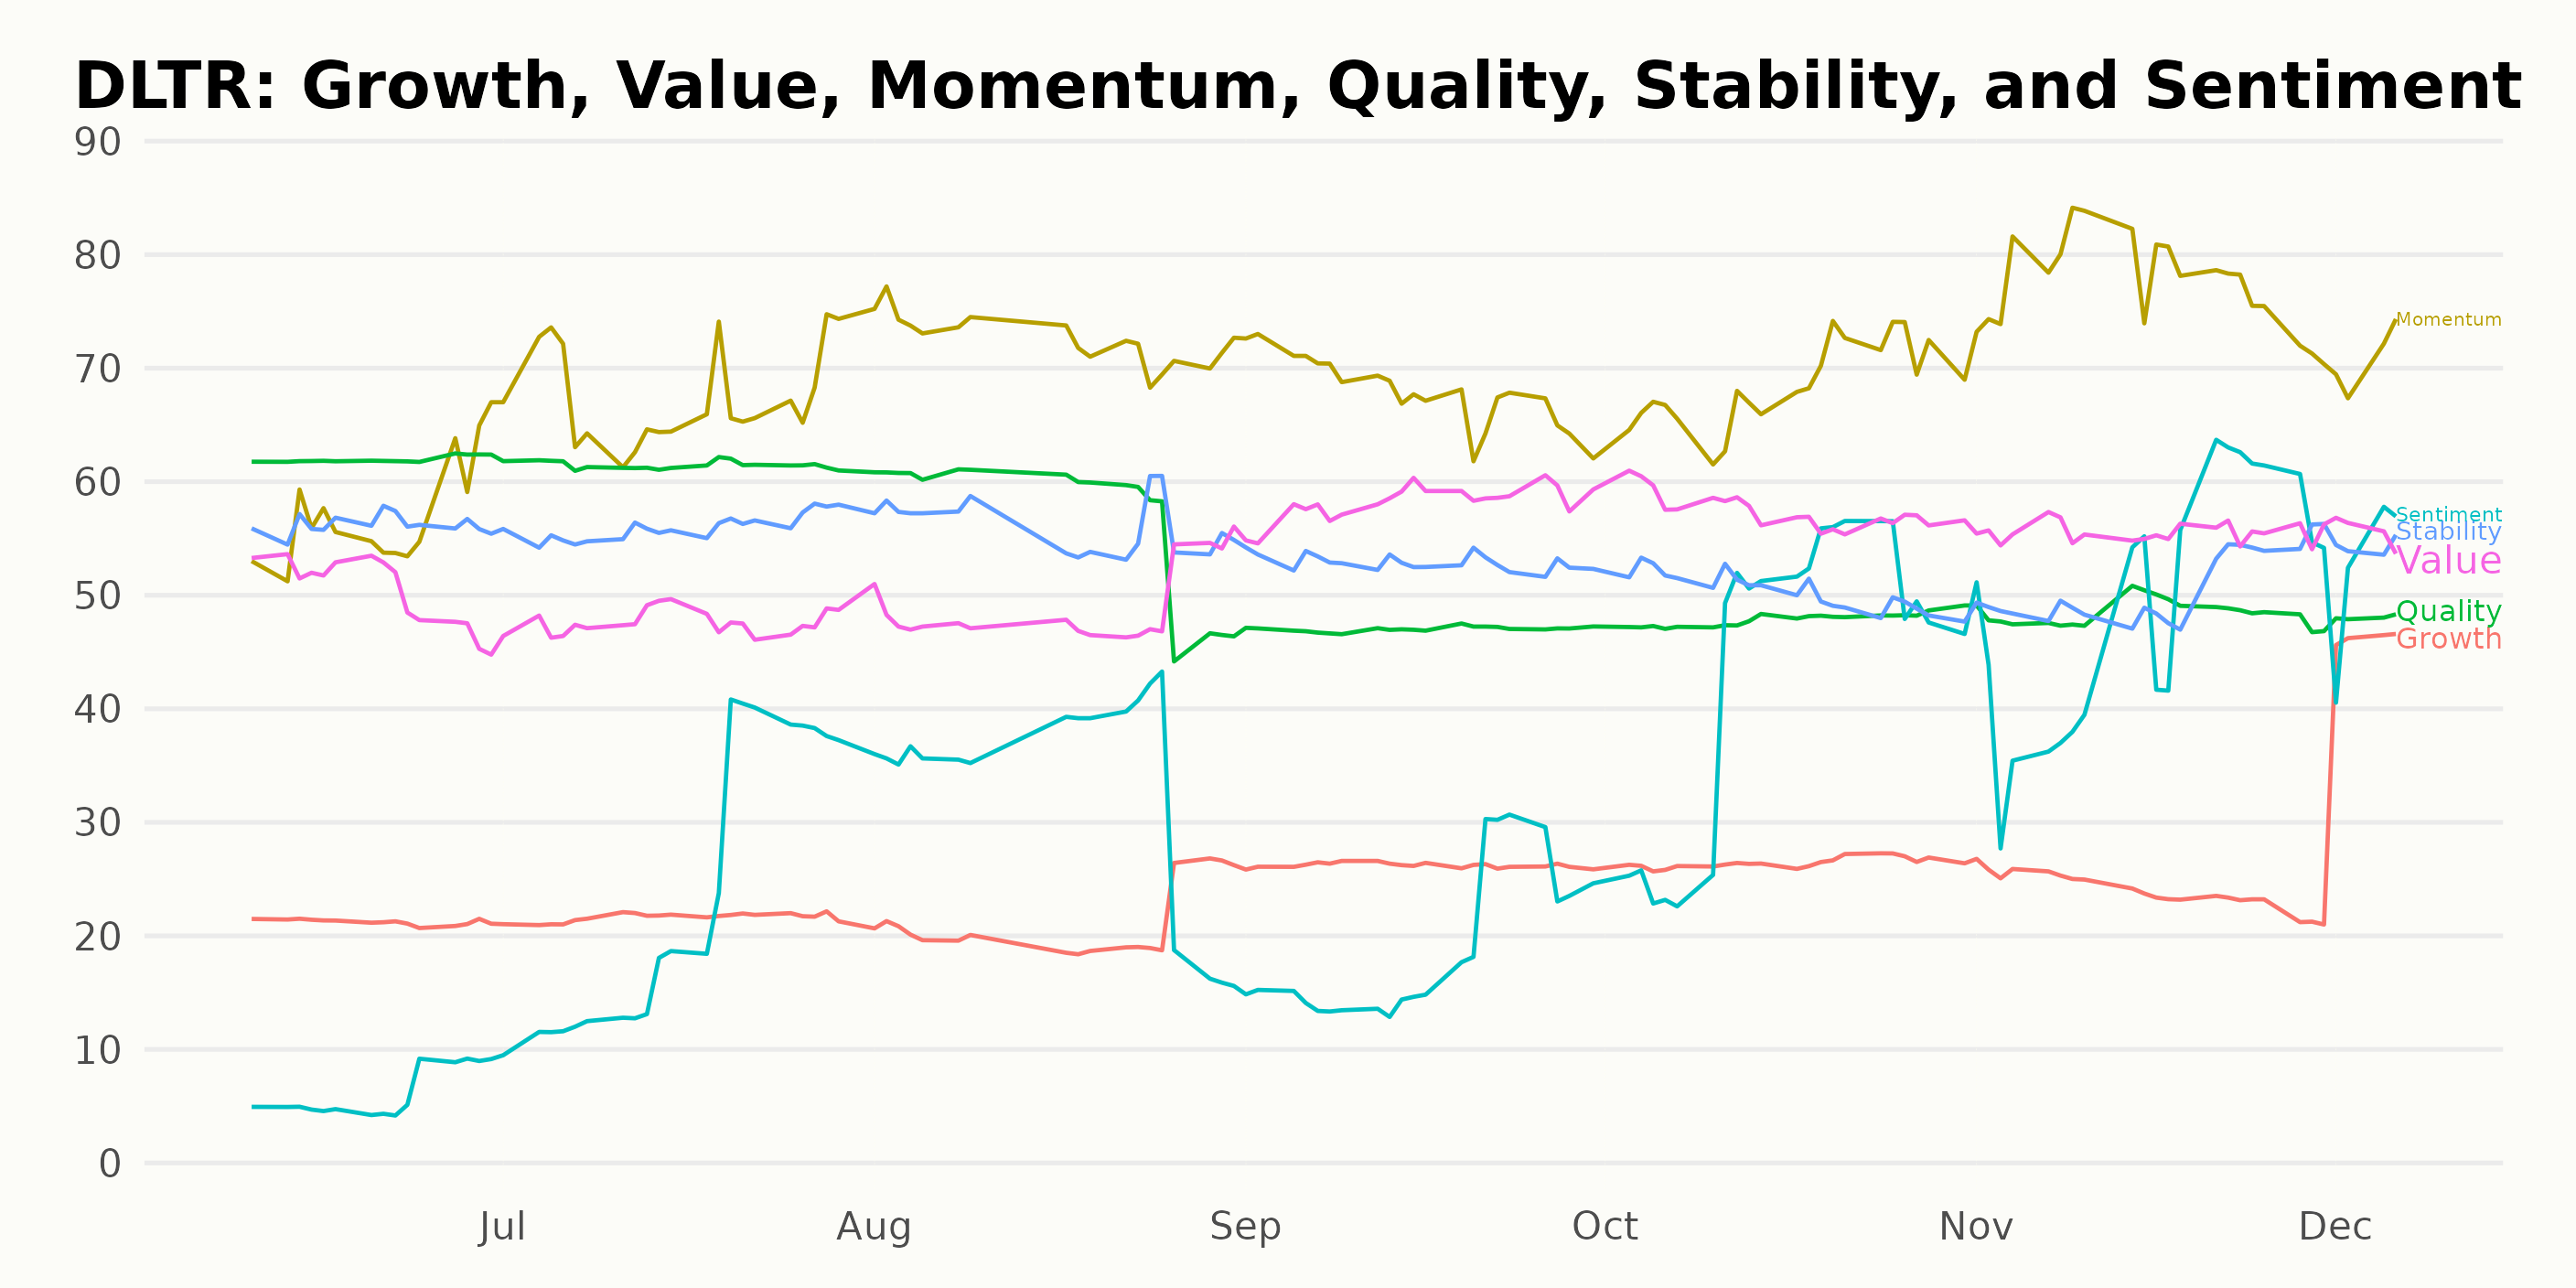
Analyzing Dollar Tree's Noteworthy Performance Trends through POWR Ratings
The POWR Ratings grade of DLTR, a company in the Grocery/Big Box Retailers category, is currently C (Neutral). This rating reflects the stock's recent performance and how it stacks up against other similar companies. Here are some key points:
- DLTR has maintained a steady POWR grade of C (Neutral) since June 10, 2023.
- The rank within its category varies slightly but remains relatively stable, ranging from #32 to #36 out of a total of 38 stocks.
- As of the most recent update on December 7, 2023, DLTR's rank in the category stands at #34.
In examining the POWR Ratings for DLTR along the six dimensions, three dimensions appear particularly noteworthy due to their high numerical values or distinct trends over time.
Momentum: This dimension has consistently high ratings from June to December 2023. From a rating of 57 in June 2023, it steadily increased to 77 in November 2023, making it the highest overall. Despite a slight dip to 71 in December 2023, this dimension consistently holds one of the highest ratings.
Value: This dimension showed a somewhat stable performance during this period but displayed a significant uplift from a Value of 50 in June to 58 in September 2023. As it hovered between 56 and 58 from September to December 2023, this dimension maintained relatively high rankings throughout the time frame observed.
Growth: Although this dimension started with one of the lowest scores (21 in June 2023), it demonstrated a clear upward trend, hitting a peak of 46 by December 2023. This considerable improvement over the period under review makes the Growth dimension an important point of observation.
By focusing on these three dimensions, you gain valuable insight into the performance trends of DLTR during this period. Notably, the increasing Momentum, the consistent Value, and the steady Growth provide a positive outlook for the company's future performance.
How does Dollar Tree, Inc. (DLTR) Stack Up Against its Peers?
Other stocks in the Grocery/Big Box Retailers sector that may be worth considering are Marks and Spencer Group plc (MAKSY), Natural Grocers by Vitamin Cottage, Inc. (NGVC), and Ryohin Keikaku Co., Ltd. (RYKKY) - they have better POWR Ratings. Click here to explore more Grocery/Big Box Retailers stocks.
What To Do Next?
Discover 10 widely held stocks that our proprietary model shows have tremendous downside potential. Please make sure none of these “death trap” stocks are lurking in your portfolio:
DLTR shares were trading at $124.38 per share on Thursday morning, down $1.65 (-1.31%). Year-to-date, DLTR has declined -12.06%, versus a 20.80% rise in the benchmark S&P 500 index during the same period.
About the Author: Anushka Dutta

Anushka is an analyst whose interest in understanding the impact of broader economic changes on financial markets motivated her to pursue a career in investment research.
The post Does Dollar Tree (DLTR) Deserve a Spot in Your Portfolio Despite Q3 Earnings Miss? appeared first on StockNews.com