Alphabet Inc. (GOOGL), a leading technology company, is harnessing the capabilities of Artificial Intelligence (AI) to bolster its operational efficiency. At its recent Cloud Next Conference, it presented Duet AI, an innovative software designed to assist developers in optimizing code. Notwithstanding potential risks tied to using generative AI coding tools, the commercialization of Duet AI could offer significant benefits to the enterprise.
Furthermore, GOOGL reportedly disclosed plans to render its suite of AI-integrated tools accessible to corporate Gmail users at a supplementary expense of $30 per user monthly. The firm anticipates generating roughly $100 million within the first year by licensing new sets of mapping data to corporations.
Notably, GOOGL reaps substantial profits thanks to its preeminent position in the market. Its trailing-12-month net income margin and Return On Common Equity (ROCE) of 21.05% and 23.33% are 484.2% and 609.7% higher than the respective industry averages of 3.60% and 3.29%.
Given this backdrop, let’s look at the trends of GOOGL’s key financial metrics to get an idea of why it could be wise to invest in the stock this September.
Analyzing Alphabet Inc.'s Financial Performance and Trends from 2020-2023
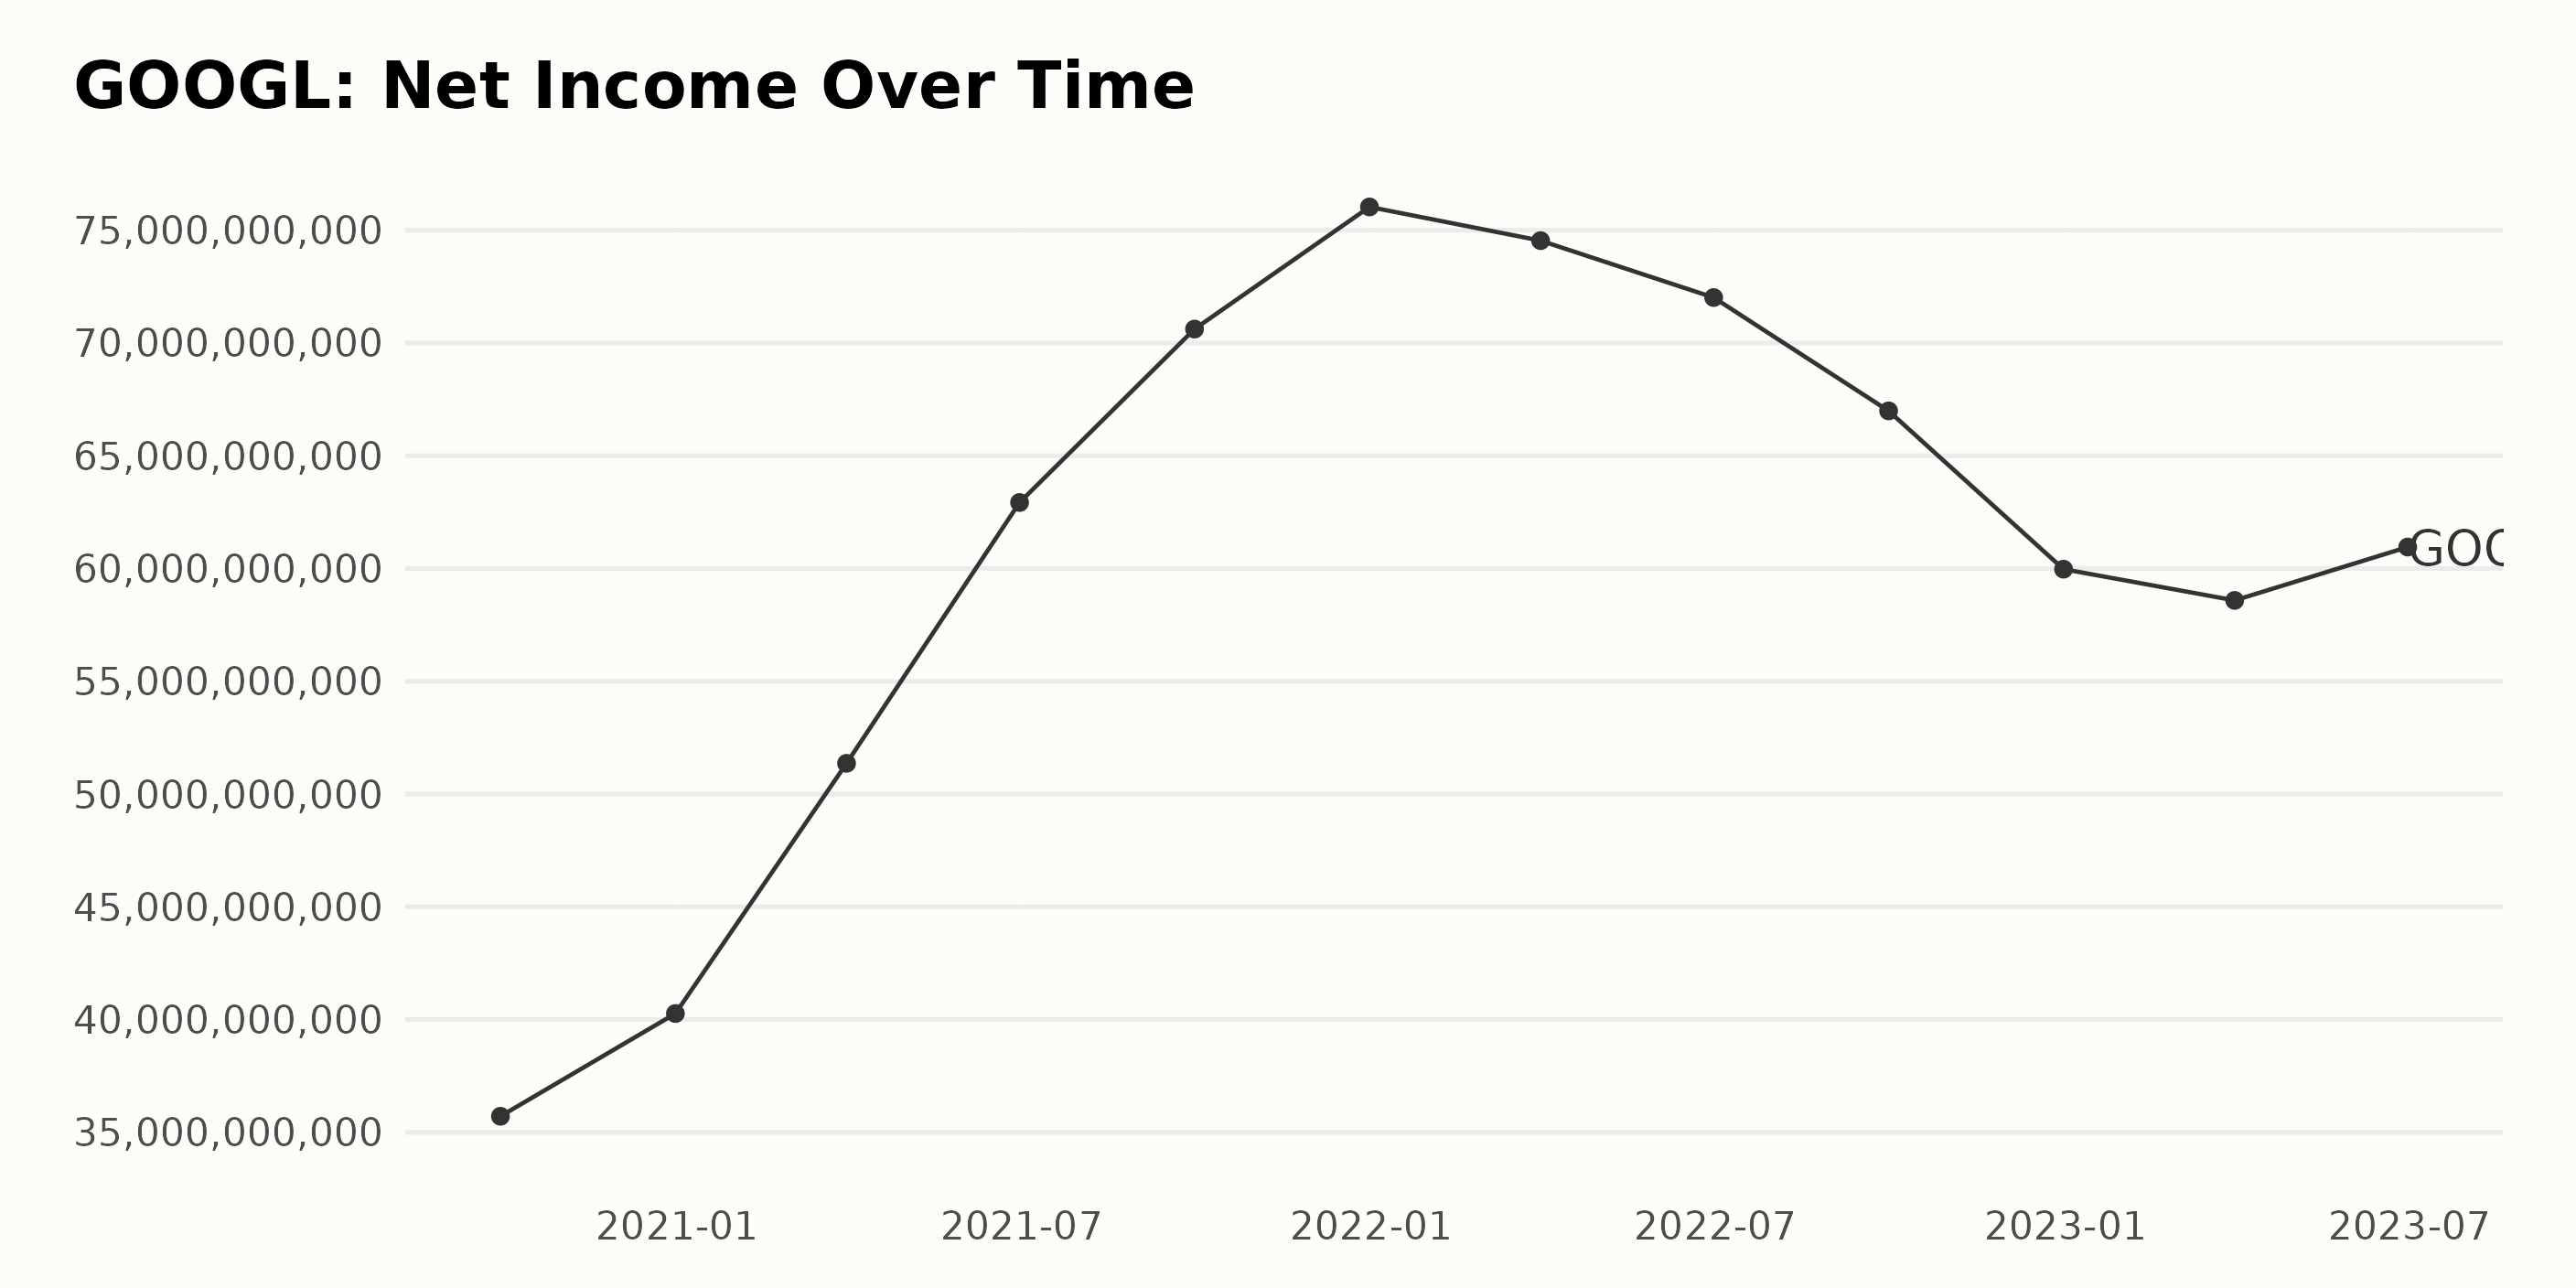
The trailing-12-month net income of GOOGL has seen significant fluctuations over the last few years. Below is a summary of the trend and fluctuations:
- On September 30, 2020, net income was reported at $35.71 billion.
- The figure then improved consistently throughout the year, reaching its peak on December 31, 2021, with $76.03 billion.
- Throughout 2022, however, the company's net income started declining, ending at $59.97 billion by December 31, 2022.
- In the first quarter of 2023, it shrunk slightly to $58.59 billion but increased again to $60.95 billion by June 30, 2023.
Comparing the net income from September 30, 2020 ($35.71 billion) to the most recent available data on June 30, 2023 ($60.95 billion), there's an overall growth of approximately 70.54%.
More recently, though, starting from peak earnings at the end of 2021, GOOGL has displayed a downward trend in net income, with short-term fluctuations visible in the data. It will be crucial to watch whether this trend continues in future quarters.
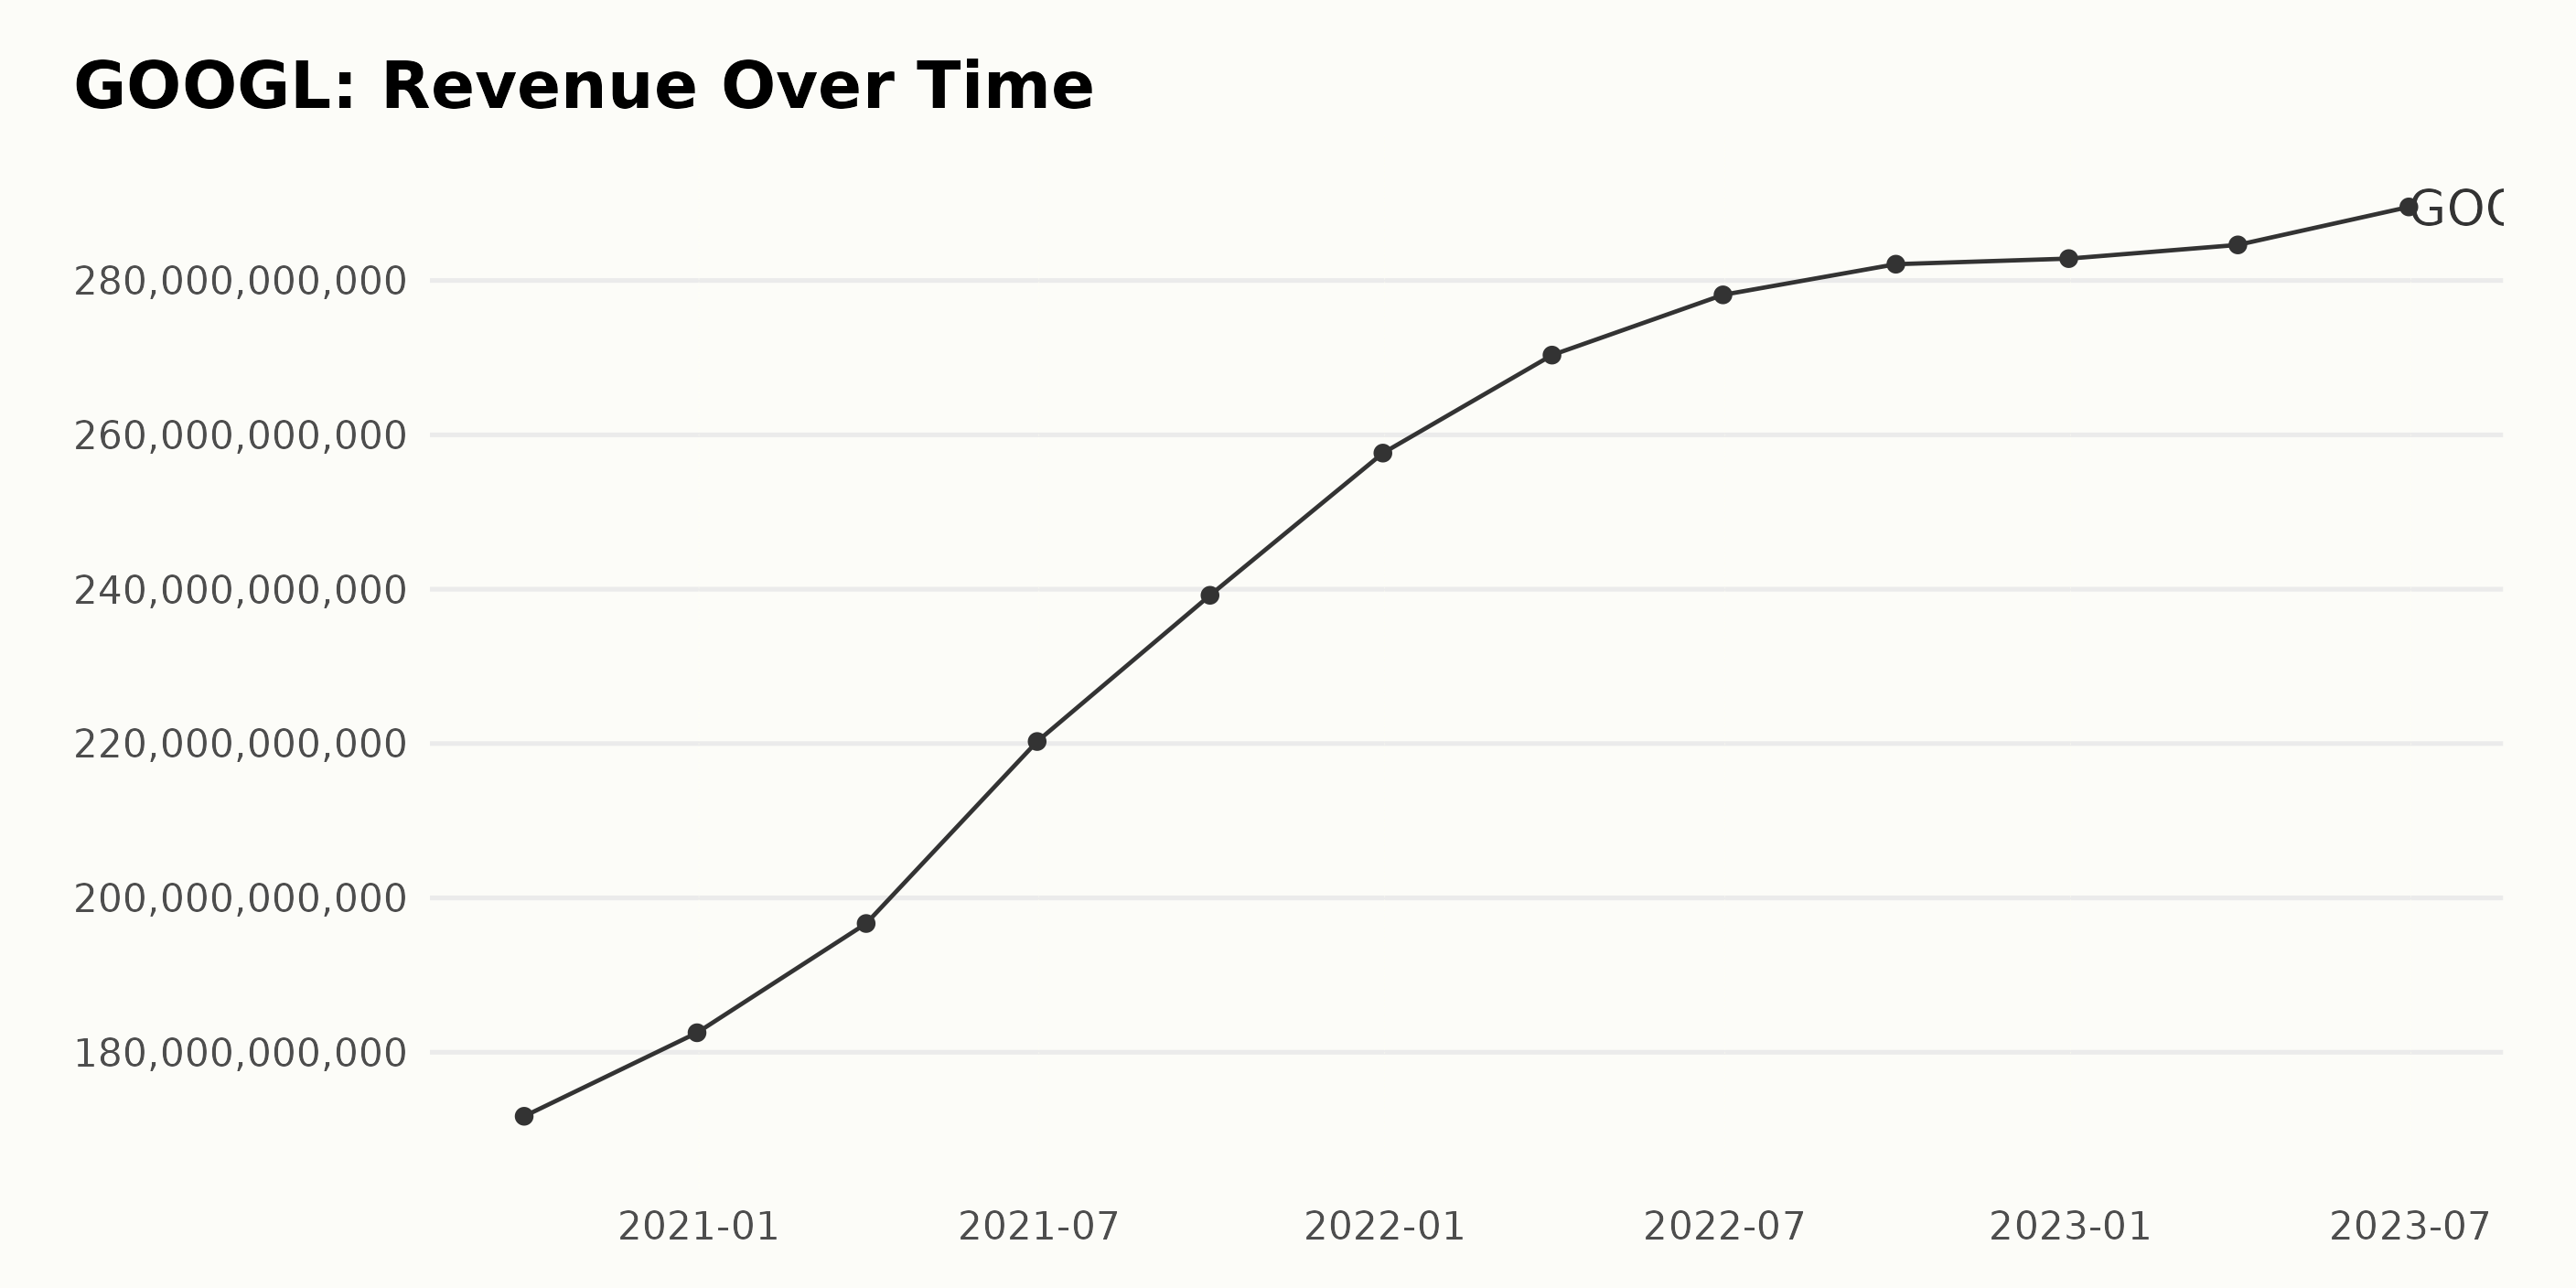
Upon examining the data, GOOGL has shown a consistent growth trend in its trailing-12-month revenue from September 2020 to June 2023. Here are notable points:
- On September 30, 2020, the revenue was at $171.70 billion.
- Significant growth was observed throughout 2021, ending with a revenue of $257.64 billion on December 31, 2021.
- The increase in revenue continued into 2022, notwithstanding some slight fluctuations in later quarters. For instance, the revenue increased from $270.33 billion on March 31, 2022, to $282.84 billion on December 31, 2022, marking an increase of about $12.51 billion.
- The growth trend proceeded into 2023, with the revenue recorded at $289.53 billion on June 30, 2023, indicating an increase.
The growth rate from the beginning of the data series to the end marks a considerable increase. Starting from $171.70 billion in September 2020 and reaching $289.53 billion by June 2023 implies an overall growth of approximately 69%.
This persistent growth in GOOGL revenue underscores an upward trend, although minor fluctuations are evident throughout the years. Most recent data points put emphasis on sustained growth despite economic uncertainties.
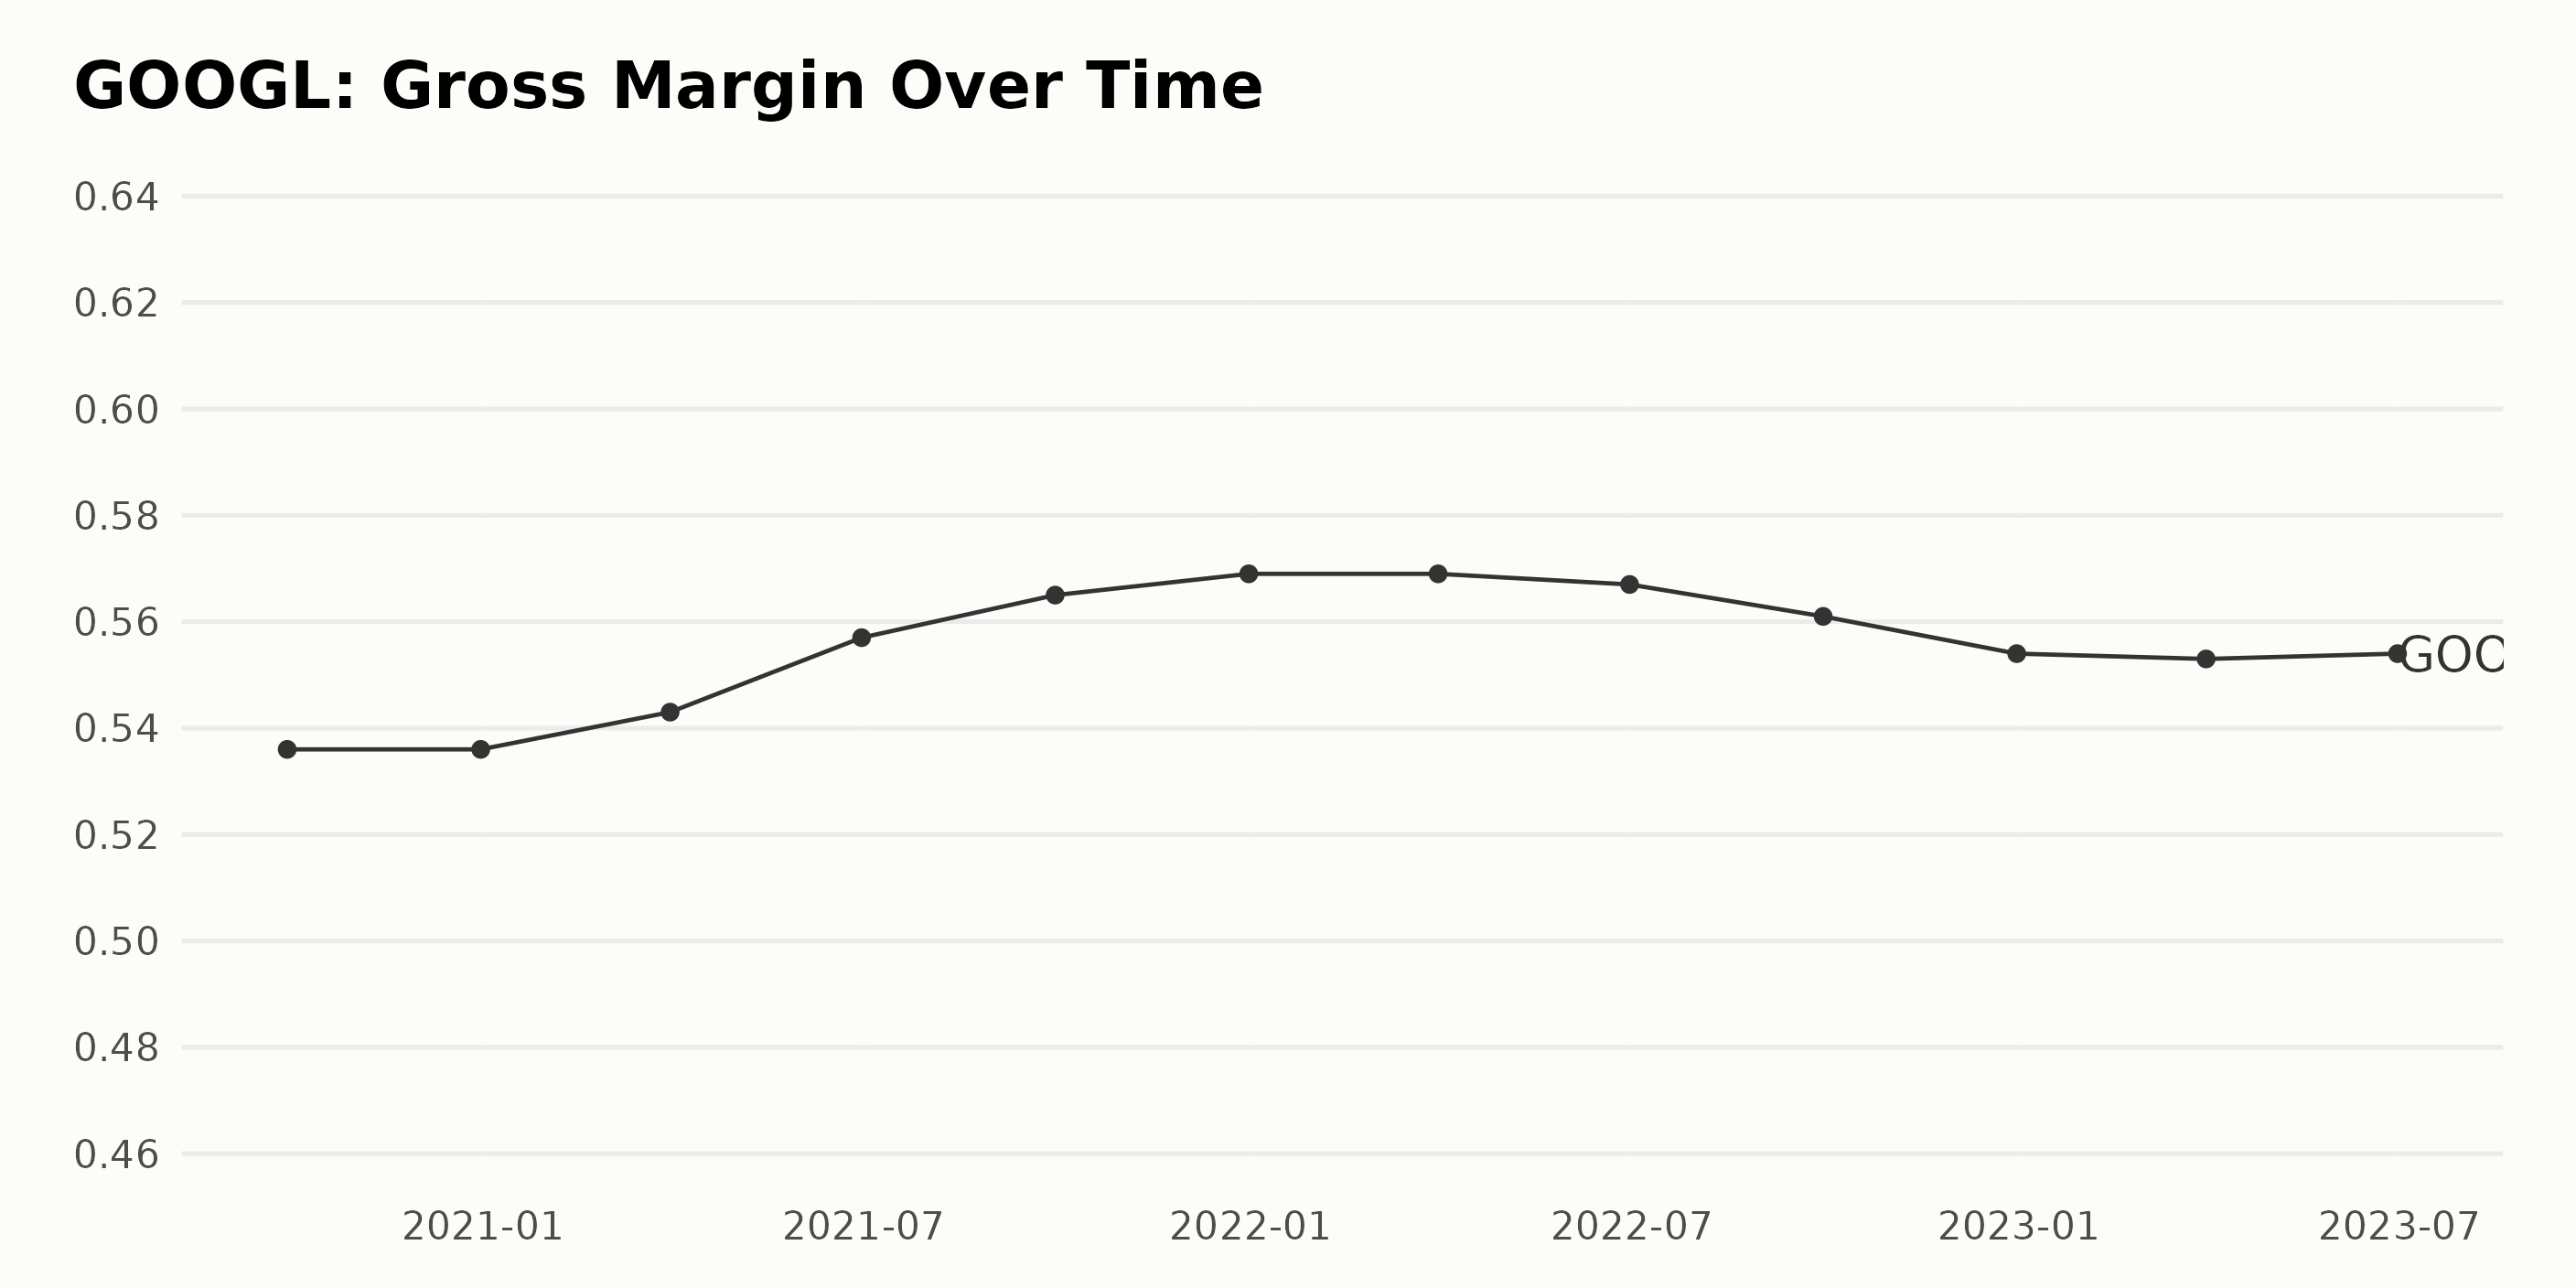
The recorded gross margin of GOOGL reflects a largely growing trend from September 2020 to December 2022, briefly stabilizing in early 2022 before observing a decline in the last three quarters of the series. Here is a summary of the gross margin trend, illustrated with highlight points:
- In September 2020, the gross margin was 53.6%.
- It remained stable at 53.6% in December 2020.
- There was a slightly positive fluctuation as the gross margin increased to 54.3% in March 2021.
- The gross margin appreciably rose to 55.7% in June 2021, marking a high point for the year.
- The same upward trend continued and reached 56.5% by September 2021.
- In December 2021, the gross margin retained its growth trajectory and stood at 56.9%.
- Notably, the figure remained unchanged at 56.9% in March 2022.
- However, a slight drop to 56.7% was observed in June 2022.
- A further decline to 56.1% was recorded in September 2022.
- The downslide continued, and by December 2022, the gross margin had reduced to 55.4%.
- A minimally lower gross margin of 55.3% was reported in March 2023.
- Finally, a marginal recovery was seen in June 2023, with the gross margin bouncing back to 55.4%.
The change in gross margin from the first entry in September 2020 (53.6%) to the last in June 2023 (55.4%) equates to a growth rate of approximately 3.35% when computed by measuring the last value from the first one. This indicates an overall increasing trend despite the recent oscillations.
Acknowledging the need to emphasize the recent data, it's important to note that the gross margin, after maintaining figures above 56% for five consecutive quarters since September 2021, has shown a downward trend since the final quarter of 2022.
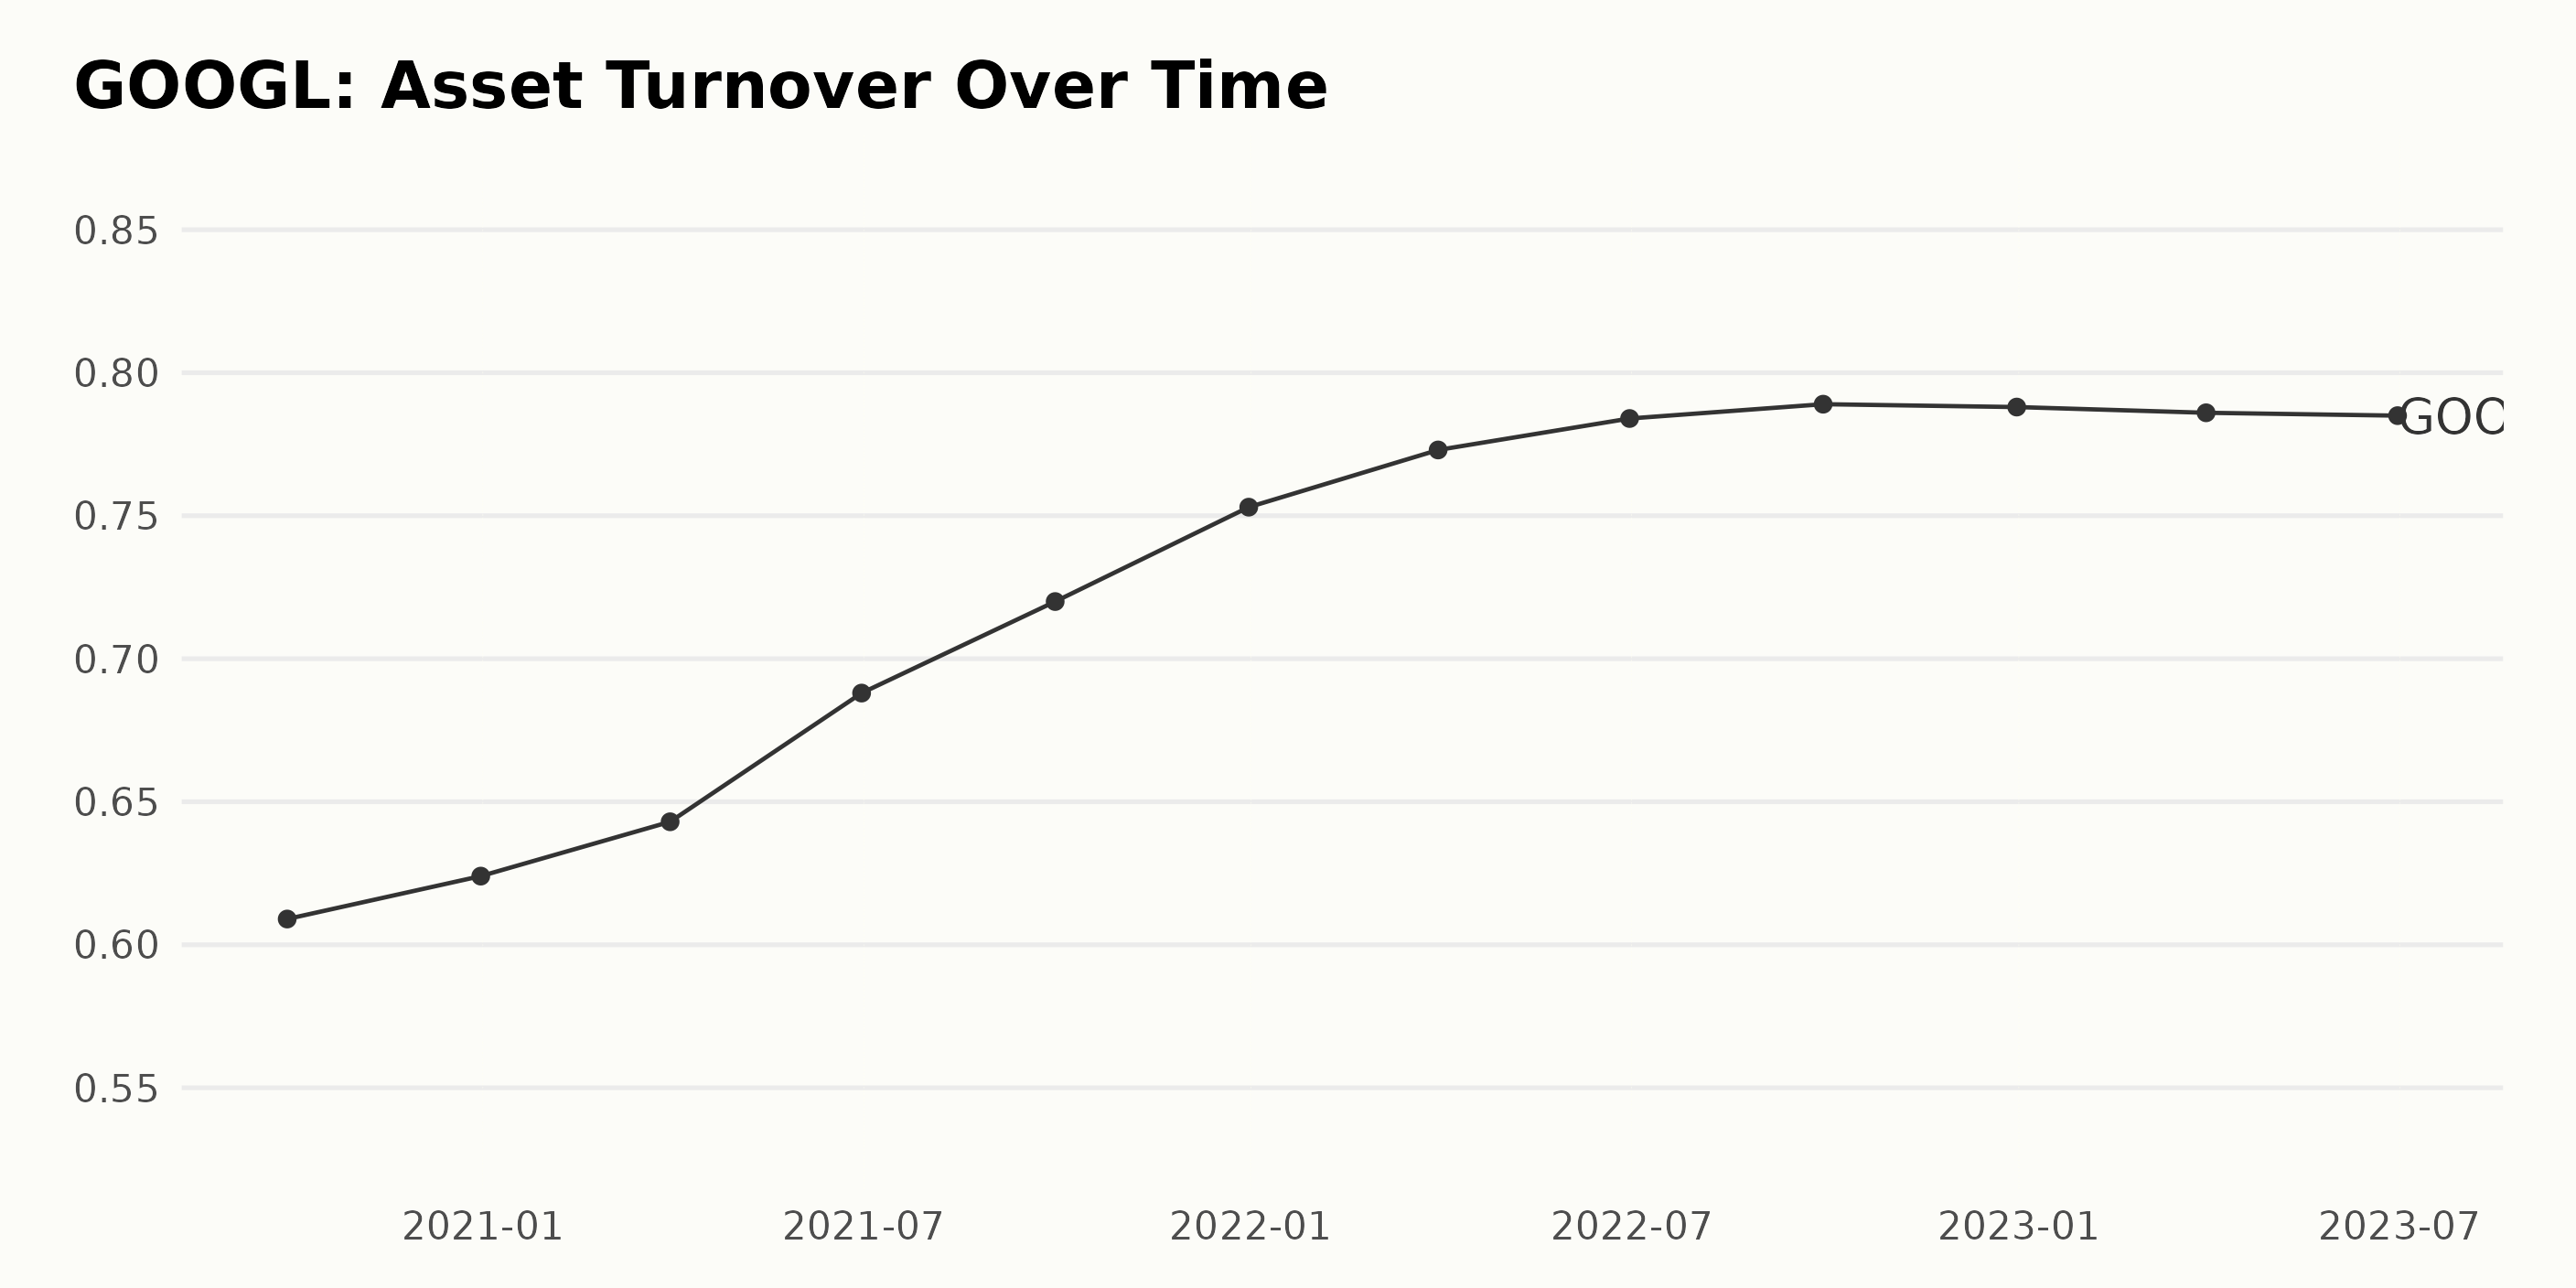
The asset turnover of GOOGL has demonstrated a general upward trend from September 2020 through December 2022, indicating improved efficiency in generating revenue from its assets. A detailed breakdown over time:
- September 2020: The asset turnover was at 0.61.
- December 2020: There was a slight increase, moving the asset turnover to 0.62.
- For the majority of 2021, there was a steady rise observed in asset turnover. It went from 0.64 in March to 0.72 in September and finally ended the year at 0.75 in December.
- The first half of 2022 saw further growth, with the asset turnover peaking at 0.78 in June.
- Thereafter, a slight decrease can be noted, ending 2022 at a slightly lower rate of 0.79 in September and closing out the year at 0.79 in December.
- Moving into 2023, a minute decrease continued. As of March 2023, the asset turnover stands at 0.79; as of June 2023, it is estimated at 0.79.
To summarize, over this analyzed period, GOOGL’s asset turnover grew by approximately 29%, which indicates the company has been more efficient at using its assets to generate sales.
However, the data also signals a potential leveling off or slight downturn of this trend in the most recent periods, indicating a future stabilization around current levels if this trend continues.
Alphabet Inc.'s Consistent Growth: A Detailed Analysis from March to August 2023
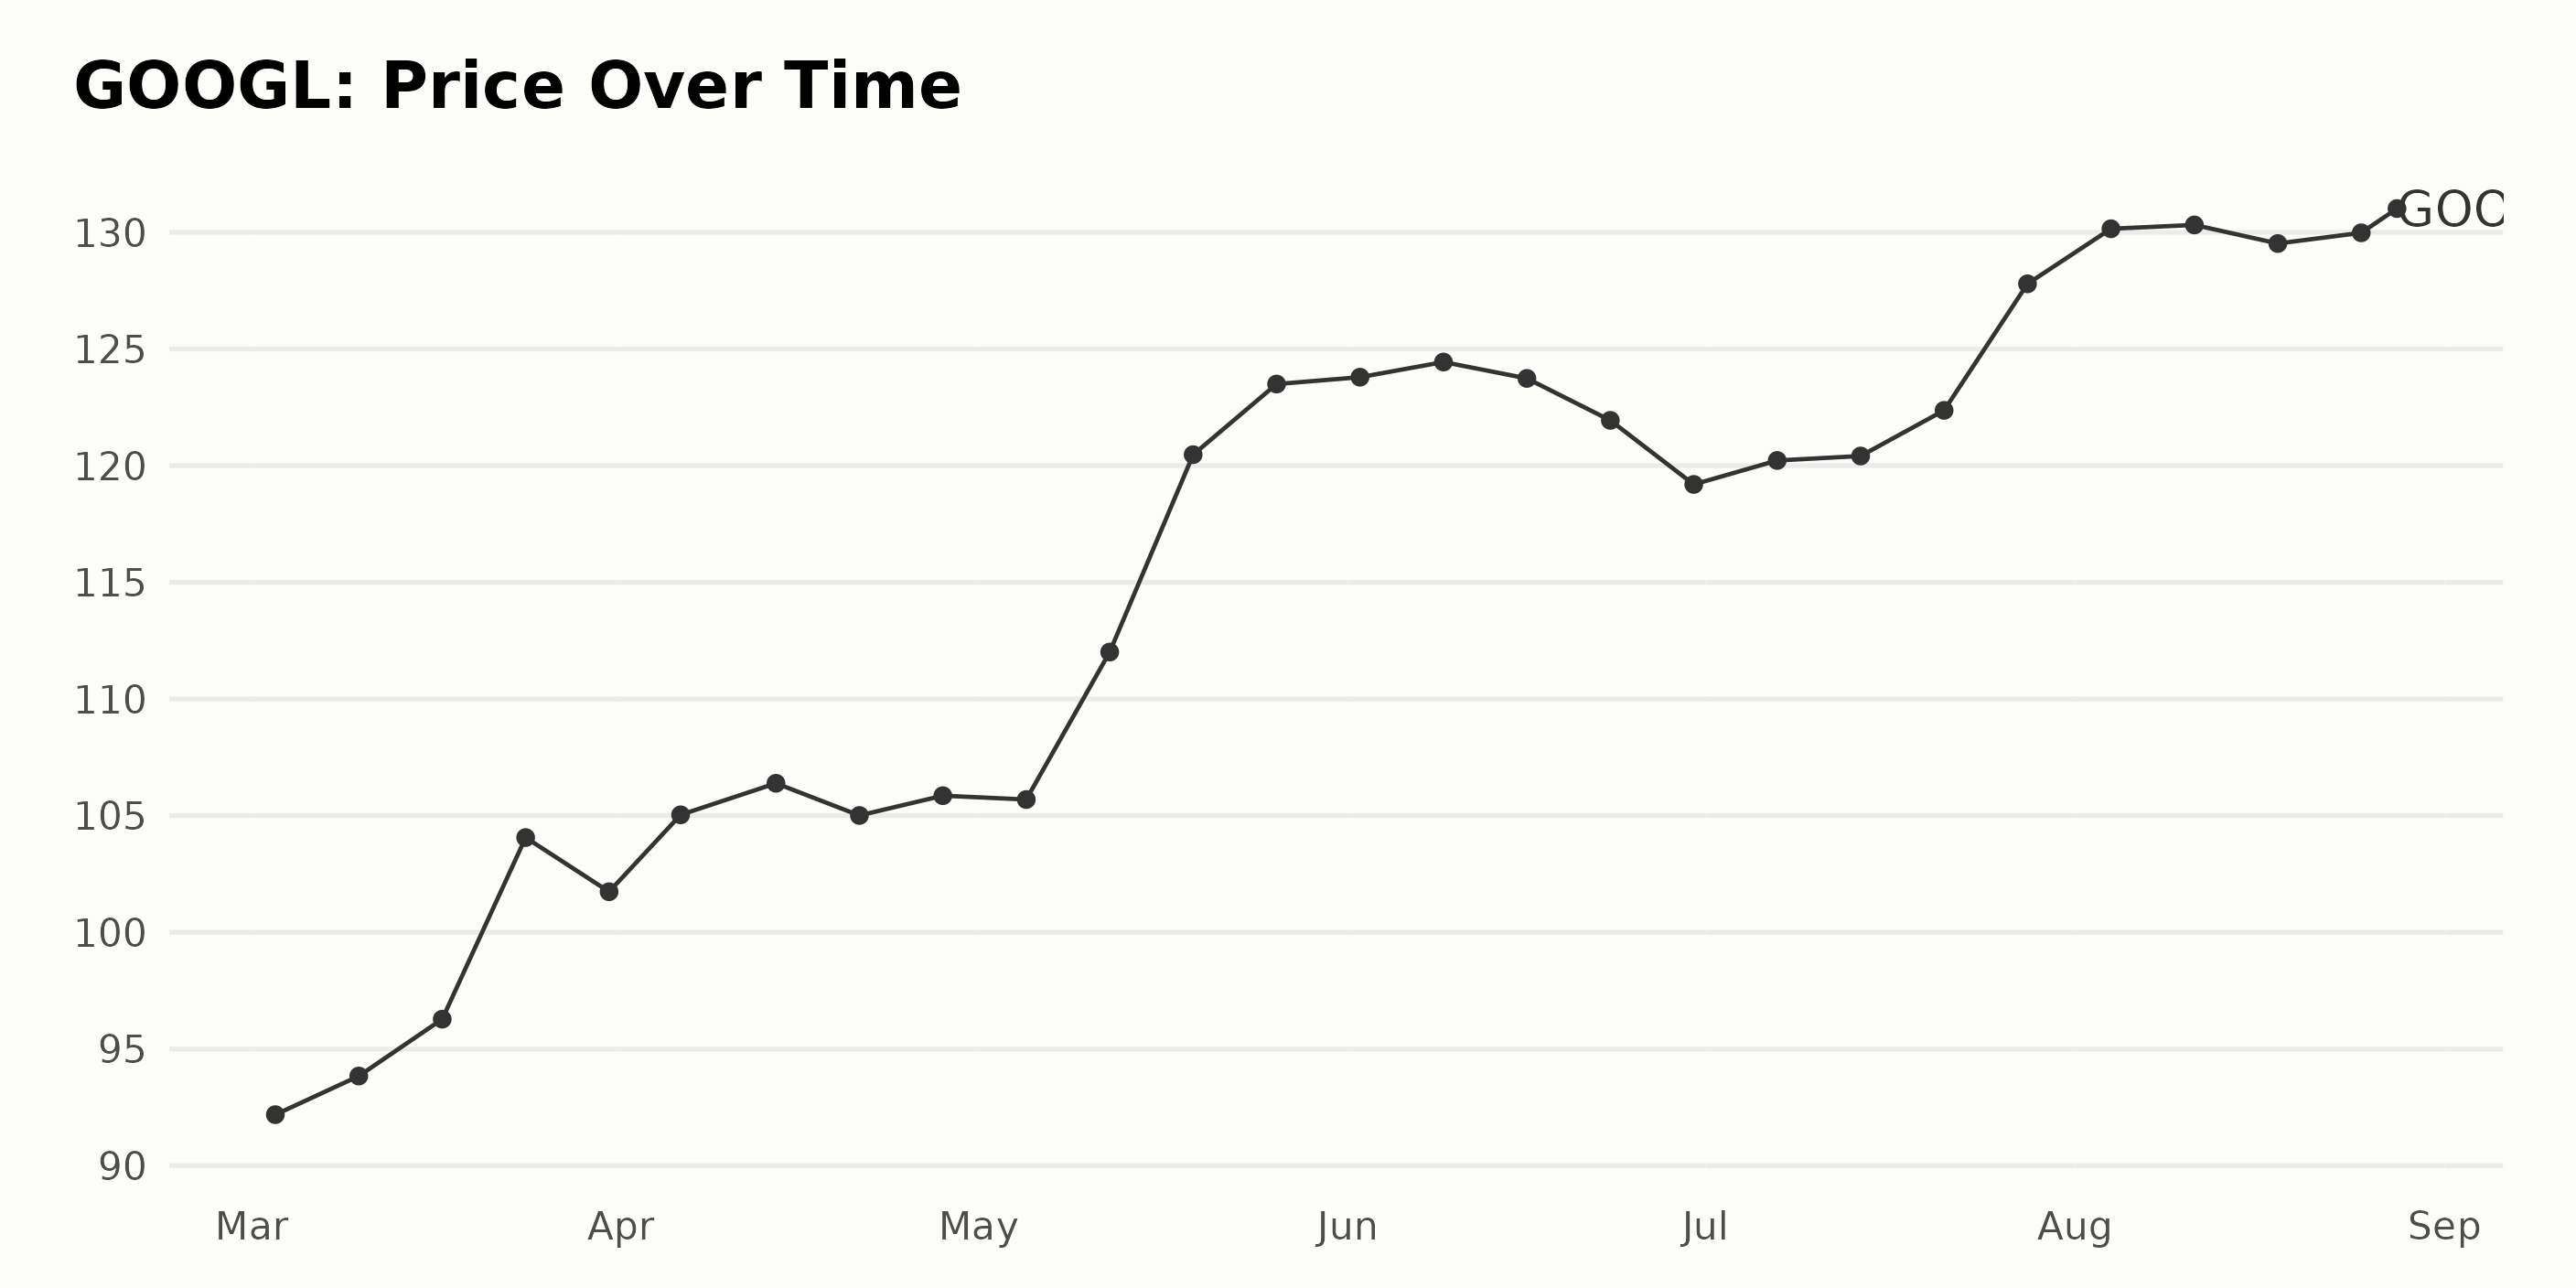
The data for GOOGL shows an overall positive trend in share price from March to August 2023, indicating steady growth.
- On March 3, 2023, the share price was $92.19.
- By March 31, 2023, it had grown to $101.74, with notable growth in the week of March 24.
- The price fluctuated slightly in April but generally continued its increase, closing the month at $105.86 on April 28.
- May saw more significant growth, with the price jumping from $105.69 on May 5 to $123.50 on May 26, indicating a substantial monthly increase.
- In June, the share prices somewhat stabilized, hovering around the mid $120s, with minor fluctuations.
- The upward trend resumed in July and into August, with the share price closing at $129.88 on August 28, 2023.
While short-term fluctuations are evident within monthly time frames, the long-term trend indicates accelerating growth. As seen in May, there was an apparent spike in prices, followed by a period of stability in June. Then, a slow yet steady increase is visible over July and August. Here is a chart of GOOGL's price over the past 180 days.
Analyzing Alphabet Inc.'s Quality, Sentiment, and Growth POWR Ratings in 2023
The POWR Ratings grade of GOOGL evolves over several months, reflecting the dynamic nature of this Internet category stock's performance.
- In March 2023, the POWR grade was a uniform C (Neutral), with rank in the category ranging from #13 to #16.
- Throughout April 2023, it maintained its C (Neutral) grade and fluctuated between ranks #14 and #15.
- The POWR grade improved to B (Buy) in the week of April 29, 2023, where it has since remained up until the available data of August 2023. This improvement also corresponded with an improved category ranking to #5 in the first week of August. Despite this gain, GOOGL's rank dropped to #7 by mid-August before slightly improving to #6 by the end of the month.
As of the latest data point on August 29, 2023, the POWR Grade of GOOGL is at B (Buy), and its rank in the category is #6, indicating a relatively strong standing within the Internet category of stocks that comprises 59 total companies.
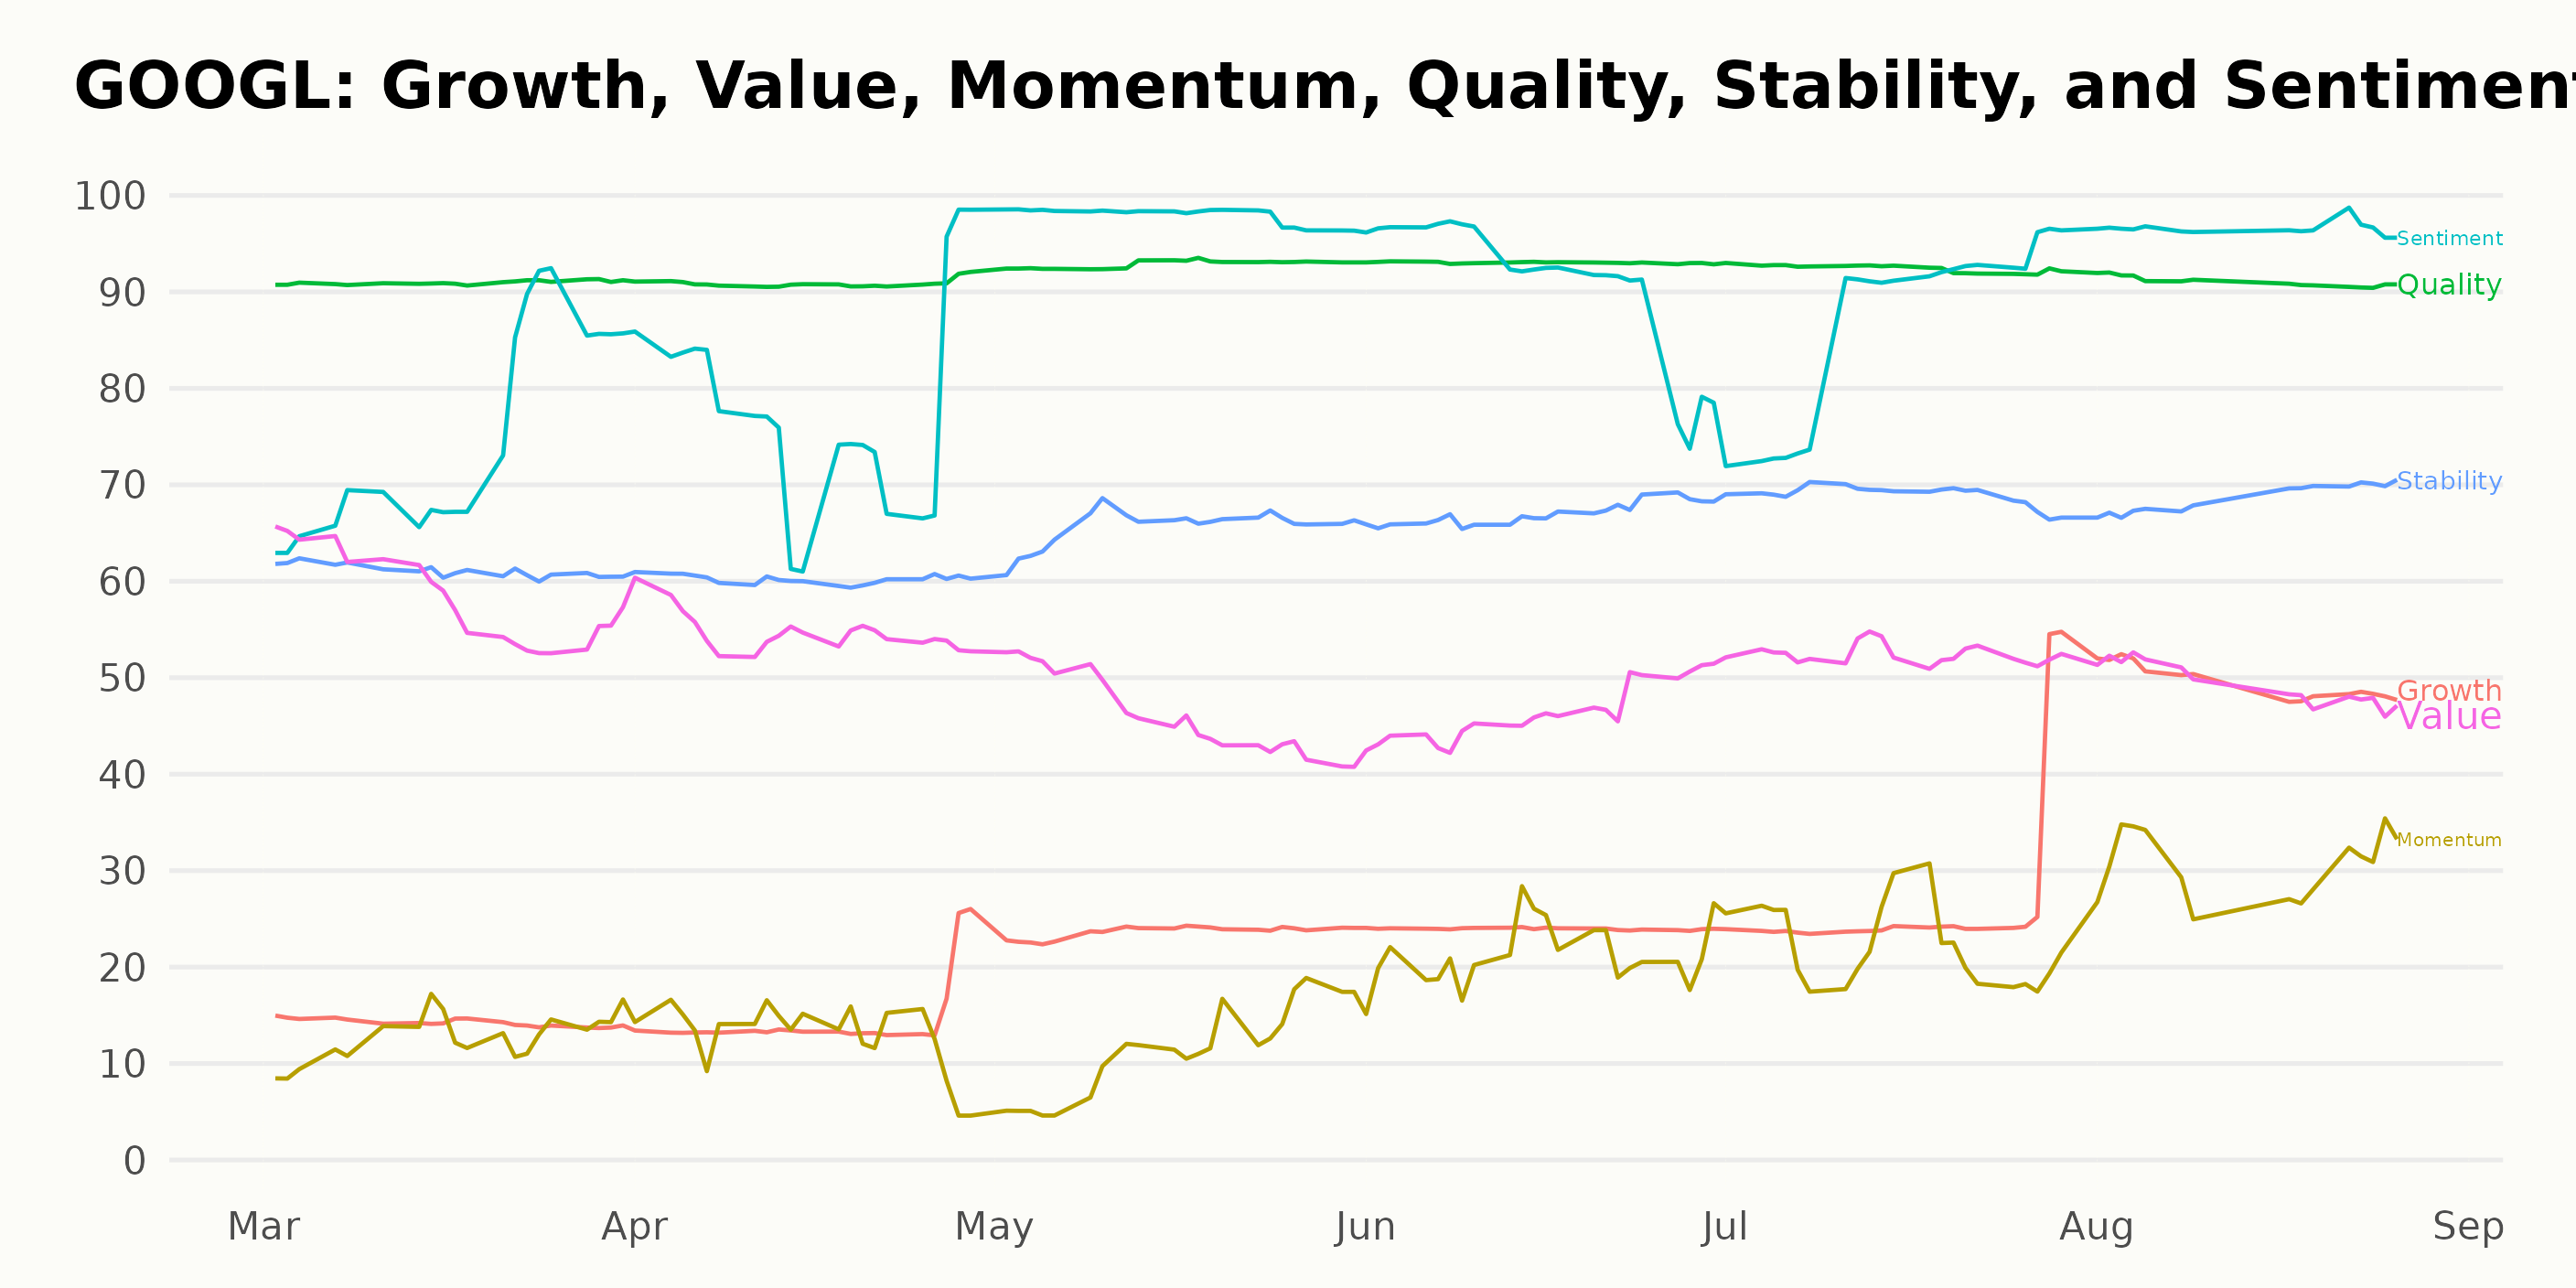
Reflecting on the POWR Ratings for GOOGL through various months of 2023, it's noteworthy to focus on three dimensions: Quality, Sentiment, and Growth.
Quality:
Throughout the assessed period, GOOGL consistently received high-Quality ratings. The value remained fairly constant, sticking close to 91-93. Changes include:
- In March 2023, the Quality rating stood at 91.
- It then stayed the same in April, at 91.
- May showed a slight increase, with the rating improving to 93.
- This value remained constant at 93 through June.
- A minor drop to 92 was observed in July.
- The rating fell back to 91 again in August, where it stayed steady.
Sentiment:
The Sentiment dimension also showed a clear upward trend:
- It started with a promising score of 75 in March.
- By April, this had increased slightly to 78.
- A significant boost occurred in May, with the number rising to 98.
- June saw a minor correction, with the rating dropping to 91.
- The Sentiment score decreased slightly to 87 in July before bouncing back to 97 in August.
Growth:
Finally, the Growth rating demonstrated considerable improvement over time:
- At the start, it was at 14 in March.
- A minor increase in April took it to 15.
- A noteworthy leap occurred in May, with the number escalating to 24, and this state persisted into June.
- The scoring took another step up to 27 by July.
- The grand upturn came around August, with the rating skyrocketing to 50.
In conclusion, GOOGL’s Quality, Sentiment, and Growth dimensions represent the most significant aspects of the company's POWR Ratings during these months of 2023.
How does Alphabet Inc. (GOOGL) Stack Up Against its Peers?
Other stocks in the Internet sector that may be worth considering are Yelp Inc. (YELP), Travelzoo (TZOO), and Despegar.com Corp. (DESP) - they have an A (Strong Buy) or B (Buy) overall rating. For exploring more A and B-rated Internet stocks, click here.
What To Do Next?
Discover 10 widely held stocks that our proprietary model shows have tremendous downside potential. Please make sure none of these “death trap” stocks are lurking in your portfolio:
GOOGL shares were trading at $135.25 per share on Tuesday afternoon, up $4.24 (+3.24%). Year-to-date, GOOGL has gained 53.29%, versus a 18.10% rise in the benchmark S&P 500 index during the same period.
About the Author: Anushka Dutta

Anushka is an analyst whose interest in understanding the impact of broader economic changes on financial markets motivated her to pursue a career in investment research.
The post Buy, Sell or Hold: What Should Investors Do With Alphabet (GOOGL) in September? appeared first on StockNews.com