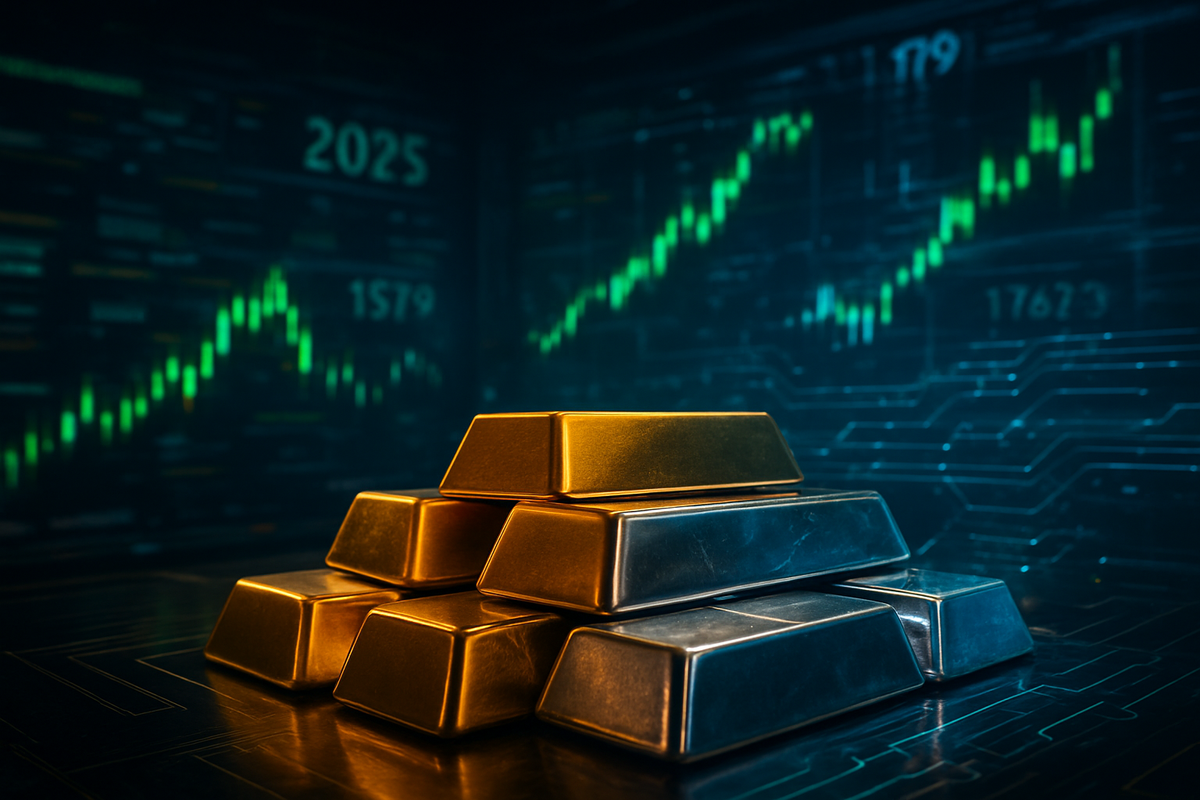
As the final trading bell of 2025 rings, the financial world is witnessing a historic milestone: gold and silver have concluded their most explosive year of growth in over four decades. Driven by a perfect storm of fiscal instability, central bank de-dollarization, and a structural silver deficit, both metals have outperformed nearly every major asset class, posting their best annual returns since the inflationary peak of 1979. Gold finished the year at a staggering $4,549 per ounce, while silver surged to $83.62 per ounce, marking a generational shift in the global perception of "hard money."
However, this record-breaking ascent was not a smooth climb. The year was characterized by extreme price swings and unprecedented volatility that tested the infrastructure of global commodities exchanges. The sheer velocity of the price movements forced the CME Group (NASDAQ: CME) to intervene multiple times, raising margin requirements to stabilize a market that many analysts described as "bordering on parabolic." For investors, 2025 will be remembered as the year precious metals transitioned from defensive hedges to the primary engines of portfolio growth.
The Road to Record Highs: A Year of Volatility and Intervention
The journey to these historic levels began in earnest during the spring of 2025, but the momentum reached a fever pitch in the fourth quarter. A pivotal moment occurred in October when a 41-day federal government shutdown in the United States sent shockwaves through the Treasury market. As confidence in the "risk-free" status of U.S. debt wavered, capital flooded into gold and silver. This flight to safety was further accelerated by a series of interest rate cuts by the Federal Reserve, which lowered the federal funds rate to a range of 3.50%–3.75% by December, significantly reducing the opportunity cost of holding non-yielding assets.
By mid-December, the silver market in particular had entered a state of "backwardation"—where spot prices trade higher than future contracts—signaling a desperate scramble for physical metal. This frenzy prompted the CME Group (NASDAQ: CME) to issue Advisory No. 25-393 on December 20, 2025, raising the initial margin for silver futures by 14% to $25,000 per contract. This was the second such hike in a 60-day period. The regulatory intervention triggered a "flash crash" on December 29, where gold plummeted $250 in a single session and silver dropped over 11% as leveraged traders were forced to liquidate positions. Despite this late-year correction, the metals recovered quickly, ending the year near their all-time highs.
Mining Titans and Industrial Victims: The Winners and Losers of 2025
The primary beneficiaries of this bull market have been the major mining corporations, whose profit margins expanded vertically as the price of their output rose far faster than their operating costs. Newmont Corporation (NYSE: NEM), the world’s largest gold producer, saw its stock price surge approximately 170% over the course of the year. With its all-in sustaining costs (AISC) remaining relatively stable near $1,500 per ounce, the company’s free cash flow reached levels never before seen in the industry. Similarly, Barrick Gold Corporation (NYSE: GOLD) leveraged its record earnings to initiate a multi-billion dollar share buyback program, resulting in a 182% year-to-date gain for its shareholders.
In the silver sector, Pan American Silver Corp. (NYSE: PAAS) and royalty firms like Wheaton Precious Metals Corp. (NYSE: WPM) emerged as the year’s top performers. These companies benefited not only from investment demand but also from a physical silver deficit of over 200 million ounces. Conversely, the "silver squeeze" created significant headwinds for industrial consumers. Solar manufacturers such as First Solar, Inc. (NASDAQ: FSLR) and major electronics firms faced surging input costs, as silver is a critical component in photovoltaic cells and AI data center hardware. For these companies, the 2025 metals rally was a double-edged sword, highlighting the vulnerabilities of global supply chains to commodity price shocks.
A Historical Echo: Comparing 2025 to the 1979 Era
The 2025 performance is frequently compared to the legendary bull market of 1979-1980, but the underlying drivers reveal a more complex global landscape. In 1979, the rally was fueled by oil shocks and the Hunt brothers' infamous attempt to corner the silver market. In contrast, the 2025 surge is structural and institutional. Central banks, led by India, China, and Turkey, have moved away from "reactive" hedging toward a strategic policy of de-dollarization. In 2025, official sector gold buying hit its third consecutive record year, as nations sought to diversify their reserves away from a U.S. dollar burdened by a $38.5 trillion national debt.
Furthermore, the "AI Squeeze" has replaced the speculative cornering of the past. Silver’s role in the 2025 economy is more vital than it was in 1979, given its necessity in the green energy transition and high-performance computing. While Paul Volcker was able to break the 1980 gold rally by raising interest rates to 20%, the Federal Reserve of 2025 found itself in a "fiscal dominance" trap. With interest payments on the national debt consuming an ever-larger portion of the federal budget, the Fed was unable to raise rates aggressively enough to suppress the metals without risking a systemic sovereign debt crisis.
Looking Ahead: Sustainability of the Bull Run in 2026
As we move into 2026, the market is divided on whether this momentum can be sustained. Short-term, the CME's margin increases may continue to act as a cooling mechanism, potentially leading to further mean reversion as speculative "hot money" exits the space. However, the long-term fundamentals remain arguably stronger than they were at the start of the year. The structural deficit in silver production is expected to persist, as new mining projects often take a decade to reach full capacity, and the demand from the AI and solar sectors shows no signs of abating.
Market participants should watch for a potential strategic pivot from the mining giants. With coffers full of cash, 2026 is likely to see a wave of mergers and acquisitions as companies like Newmont (NYSE: NEM) and Barrick Gold (NYSE: GOLD) look to acquire smaller explorers to replenish their reserves. Additionally, any further deterioration in the U.S. fiscal outlook or a continuation of the central bank buying spree could provide the catalyst for gold to challenge the $5,000 level in the coming year.
Summary and Investor Takeaways
The year 2025 has redefined the precious metals market, marking the end of a long period of consolidation and the beginning of what many believe is a new "Golden Era." The key takeaways for the year include:
- Record Performance: Gold and silver achieved their highest annual percentage gains since 1979, ending at $4,549 and $83.62 respectively.
- Regulatory Friction: High volatility led the CME Group (NASDAQ: CME) to raise margins twice, highlighting the risks of high-leverage trading in this environment.
- Institutional Shift: Central bank buying and fiscal concerns have replaced retail speculation as the primary drivers of value.
Moving forward, investors should remain vigilant regarding the impact of high metal prices on the broader economy, particularly in the tech and energy sectors. While the "flash crash" of late December serves as a reminder of the volatility inherent in these markets, the underlying theme of 2025—the return of hard assets to the center of the global financial system—is a trend that appears far from over.
This content is intended for informational purposes only and is not financial advice


