
If you've been keeping track of oil prices, especially since OPEC cut production by an additional 1.16 million barrels daily, you might be searching for ways to invest in the oil market. There are so many oil and energy stocks to choose from. Researching and filtering through the sector can take much legwork. You may have too many NYSE: XOM">oil and energy stocks on your list to buy. A more straightforward way to gain exposure in the oil market is to consider an exchange-traded fund (ETF) like the Energy Select Sector SPDR Fund (NYSEARCA: XLE). This ETF holds positions in some of the market's best-performing, well-known and widely-owned oil and energy companies. Let the portfolio managers handle the legwork.
About the XLE
The XLE looks to provide exposure to the energy sector of the S&P 500 index. It takes investments in oil, gas, energy equipment, consumable fuel and services. Oil, gas, and consumable fuels make up 91.51%, and energy equipment and services 8.49% of the fund. XLE was launched on Deb. 16, 2998 and has had an 8.06% performance since inception. State Street Global Advisors (SSGA) Fund Management, Inc is its investment manager. The estimated 3-year to 5-year EPS growth rate is 10.66% and has a 0.10% gross expense ratio. Its price-book ratio is 2.11, and its price-earnings ratio is 9.64 as of May 4, 2023. The weighted average market gap is $187 billion. It was 445.67 million shares outstanding with $34.8 billion in assets under management (AUM) and $41.1 million in net cash. The fund trades down (4.9%) year-to-date and has an average annual dividend yield of 4.01% paid out quarterly.
Top 5 Holdings
The XLE holds 23 stocks in the oil and energy industry. The list of the top five holdings and weightings are:
- Exxon Mobil Corp. (NYSE: XOM) with a 23.67% weighting with 77.596 million shares.
- Chevron Corp. (NYSE: CVX) with a 19.92% weighting with 44.332 million shares.
- EOG Resources Inc. (NYE: EOG) with a 4.69% weighting with 14.637 million shares.
- ConocoPhillips (NYSE: COP) with a 4.40% weighting with 15.700 million shares.
- Schlumberger N.V. (NASDAQ: SLM) with a 4.16% allocation with 32.06 million shares.
It's noteworthy that two stocks, XOM and CVX, comprise 43% of the total portfolio weighting. The weightings are based on market capitalization. If ranked by total shares owned, Schlumberger would be in the third spot behind Chevron.
Oil Markets Catalysts
April 2, 2023, OPEC's announcement to cut oil output by an additional 1.16 million barrels daily caused the XLE to shoot 4.53% higher to close at $86.32. Shares have since pulled back to close the gap and break down to retest the weekly rising trendline. Any event that impacts the oil markets can impact the XLE. Geopolitical events in the Middle East and various oil-producing nations can spike the price of crude oil. These can include instability, tensions, diplomatic disputes and civil unrest that can impact oil prices. Natural disasters can also impact oil production. Be aware of any government regulations that change energy policy or disrupt the supply and demand of oil.
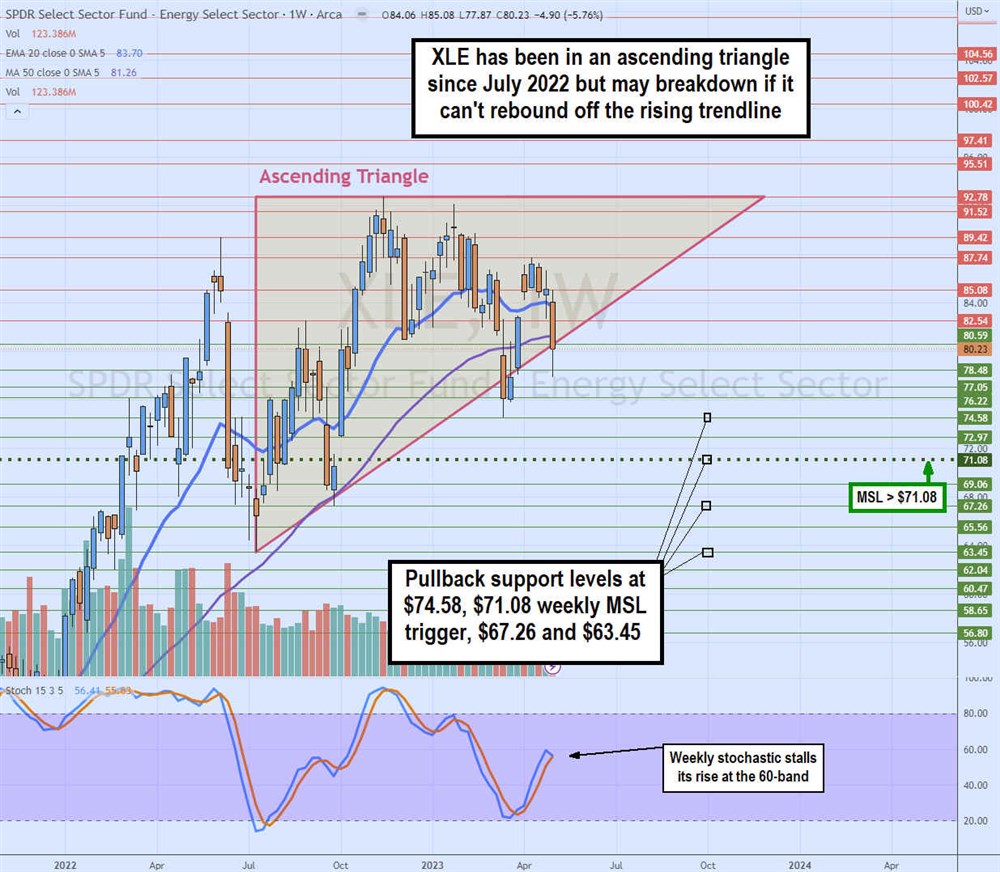
Weekly Ascending Triangle
The weekly candlestick chart on XLE has been in a weekly triangle comprised of a flat-top trendline caping bounces and a rising trendline raising the bids. The weekly ascending trend line commenced after hitting a swing low of $63.45 in July 2022. Shares triggered a weekly market structure low (MSL) breakout staging a rally to a swing high of $92.78 by November 2022. XLE continued to make higher lows on pullbacks as they retested the rising trendline in May and May 2023 at higher bounce levels.
The weekly stochastic bounced off the 20-band but is stalled at the 60-band as shares test the rising trendline after initial overshoots. The weekly 20-period exponential moving average (EMA) resistance is flat at $83.70, and the weekly 50-period MA at $81.26. If a breakdown occurs, watch pullback support levels at $74.58, $71.08 weekly MSL trigger, $67.26 and $63.45.


