London-based luxury fashion brand retailer Capri Holdings Limited (NASDAQ: CPRI) stock plunged 20% on its fiscal Q3 2023 earnings release. Sales for ultra-premium brands like Versace and Michael Choo were hit less than lower premium brand Michael Kors. Weak consumer demand stemming from high inflation and dampened consumer discretionary spending have spared few apparel makers and retailers.
Shares of premium apparel makers like PVH Corp. (NYSE: PVH), makers of Calvin Klein and Tommy Hilfiger apparel, Ralph Lauren Co. (NYSE: RL), and Canadian Goose Holdings Inc. (NASDAQ: GOOS) were all hit. Even Lululemon Athletica (NASDAQ: LULU) felt NASDAQ: LULU">margin compression as margins fell 125bps. While higher-end luxury brands tend to weather a recessionary environment better than mid-to-lower-range brands, a reversion is still inevitable.
Earnings Miss
On Feb. 8, 2022, Capri Holdings released its fiscal third-quarter 2023 results for December 2022. Gross profit was $1.01 billion and gross margin of 66.3% versus gross profit of $1.05 billion and 65.1 gross margins in the year-ago period. The Company reported earnings-per-share (EPS) of $1.84, excluding non-recurring items missing consensus analyst estimates of $2.24 by $0.40. Revenues fell 6% year-over-year (YoY) to $1.51 billion, missing estimates for $1.54 billion.
Capri Holdings CEO John Idol commented, "However, we were disappointed with the performance of our global wholesale business in the quarter, which resulted in expense deleverage and a lower operating margin. We have begun taking measures to better align operating expenses with the change in revenue by channel. At the same time, we will continue to make strategic investments to drive long-term growth."
Downside Guidance
Capri Holdings sees fiscal Q4 2023 EPS between $0.95 to $0.90 versus $1.39 consensus analyst estimates. Revenues are expected at $1.275 billion versus $1.41 billion analyst estimates. The Company lowered fiscal full-year 2024 EPS to $6.40 versus $7.24 consensus analyst estimates. Capri Holdings expects fiscal full-year 2024 revenues of $5.8 billion versus $6.02 billion analyst estimates.
Citi Reiterates Buy Rating but Cuts Target Price
Citi reiterated its buy rating on Capri Holdings shares but cut its price target to $63 from $75. Citi analyst Paul Lejuez pointed out that the market reaction plummeting the stock by nearly 25% was an overreaction.
He commented, “The 3Q miss and guidance reduction were certainly a disappointment (and a surprise), but we believe the 25% stock decline is unwarranted. Issues in Kors’ US wholesale channel can’t be ignored, but the strong performance in Kors’ retail channel supports the underlying health of the brand.” He also pointed out that Versace performed above expectations in the quarter.
Cowen Cuts Rating to Market Perform
Cowen analyst Oliver Chen dropped his rating on Capri Holdings shares to a market performance with a $55 price target, down from $70. Chen commented, “We downgrade shares of CPRI to Market Perform on fears that the wholesale channel could get worse before improving, as well as concerns on customer demand at MK amid a somewhat bumpy path thus far as the brand pursues an elevation strategy,” He also believes that Capri is losing market share to other premium brands including LVMH Moët Hennessy Louis Vuitton SE (OTCMKTS: LVMUY) and Tapestry Inc. (NYSE: TPR) maker of Coach.
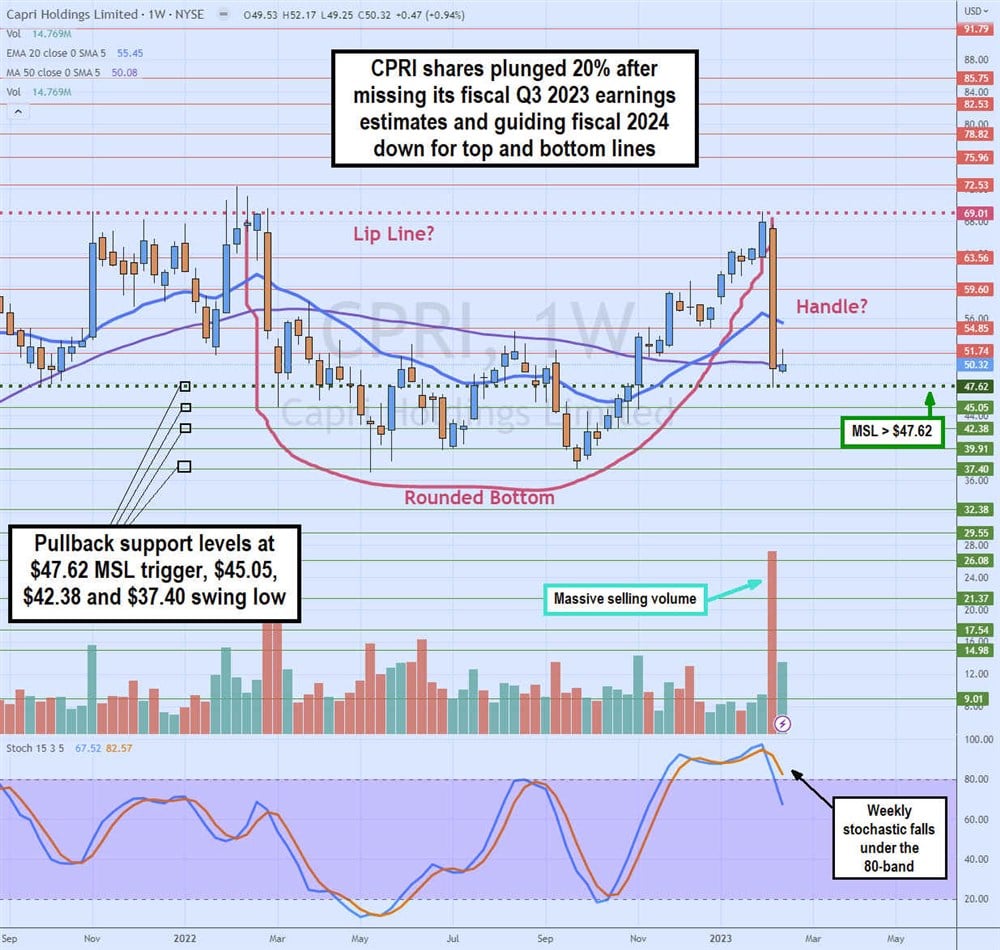
Weekly Cup and Handle?
CPRI weekly candlestick chart shows the completion of the cup and may be forming a handle. The lip line formed at $69.01 in February 2022 as shares fell towards $37.40 lows. A rounding bottom took until September 2022 to form as the lows were retested before staging a rally through the $47.52 market structure low (MSL) breakout trigger.
CPRI shares climbed to the $69.01 lipline before plunging on its earnings report. Shares fell to the $47.62 weekly MSL trigger before coiling and attempting to bounce through the 50-period moving average (MA) at $50.08. The weekly stochastic fell through the 80-band. If the weekly MSL trigger can hold support and stage a rally, then a handle formation can materialize as shares rally back up through the lip line to complete a weekly cup and handle pattern.
Pullback support levels are at $47.62 weekly MSL trigger, $45.05, $42.38, and $37.40 swing low.


