
- The pandemic was the driver that blew up Etsy’s business and stock price. The question is whether it can continue to grow.
- Etsy stock is down (-40%) for the year
- While growth has slowed as the pandemic dissolves further in the rearview mirror, it’s still there
Still Growing… at a Slower Pace
While growth has slowed as the pandemic dissolves further in the rearview mirror, it’s still there… but at a slower pace. Valuation has fallen dramatically as shares trade at a premium 29X earnings and 6.6X sales, versus 64X earnings and 14.2X sales at the end of 2021. Shares are still expensive compared to a mature digital marketplace like eBay trading at 11.6X forward earnings and 2.97X sales. However, the premium for Etsy takes into account that its still growing top line by 10.6% versus eBay top line falling (-9.2%) in their fiscal Q2 2022. Of course, eBay is more than 12X the size of Etsy, which is why it’s a mature company but also shows that Etsy has more room to grow. Prudent investors looking for a post-pandemic online marketplace that’s still growing, can look for opportunistic pullbacks in shares of Etsy.
Earnings are Still Beating Estimates
On July 27, 2022, Etsy released its fiscal second-quarter 2022 GAAP results for the quarter ending June 2022. The Company reported earnings-per-share (EPS) profit of $0.51 versus $0.32 consensus analyst estimates, beating estimates by $0.19. Revenues rose 10.9% year-over-year (YoY) to $585.2 million versus $556.85 million consensus analyst estimates. Consolidated gross merchandise sales (GMS) fell (-0.04%) at approximately $3 billion. Despite the headwinds working against the Company, Etsy affirmed its in-line revenue guidance of $540 million to $575 million versus consensus estimates for $569.96 million sales.
Life After the Pandemic
Etsy CEO Josh Silverman commented, "Our second quarter results once again reflect that Etsy has maintained most of our pandemic gains, and that we are able to deliver strong bottom line performance while simultaneously investing in key initiatives. Despite facing headwinds caused by macroeconomic and geopolitical factors, we believe the improvements we've driven in customer experiences across the Etsy marketplace and our House of Brands, coupled with continued focus on our 'Right to Win' strategy, will enable us to unlock the enormous long-term opportunities we see ahead."
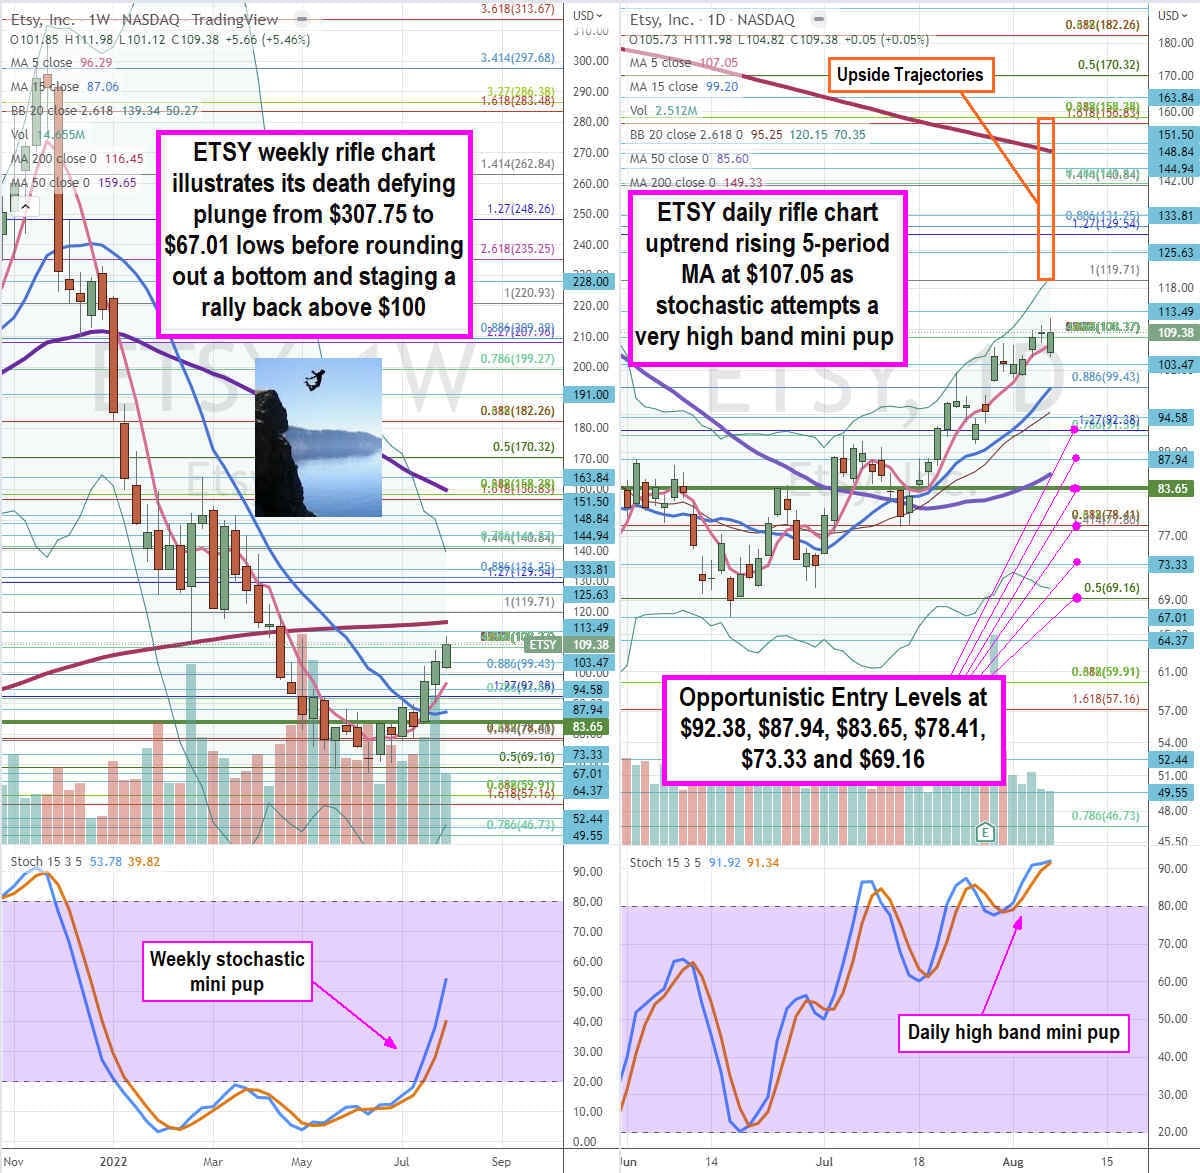
ETSY Opportunistic Entry Level to Consider
Using the rifle charts on the weekly and daily time frames provides a precision near-term view of the price action landscape for ETSY stock. The weekly rifle chart formed an inverse pup breakdown after peaking at the $163.80 Fibonacci (fib) level. The weekly 5-period is falling at $135.48 with 15-period MA following down at $154.65. The weekly 200-period MA sits at $112.30. The weekly stochastic attempted a mini pup but has stalled under the 20-band which will result in either a mini pup through the 20-band or a cross back down from rejecting off the 20-band. The weekly market structure low (MSL) trigger sits at $121.37. The daily rifle chart is in a breakdown with the 5-period MA at $134.52 crossing back down through the 15-period MA at $135.64. The daily 50-period MA is falling at $140.68. The daily lower Bollinger Bands (BBs) sit at $113.80. Shares may have spiked too far too fast from the lows, so it’s best to be patient looking for entries waiting for the daily stochastic to come back down under the 80-band. Prudent investors can watch for opportunistic pullback levels at the $121.37 weekly MSL trigger, $115.89, $113.12 fib, $107.44, $102.49, $95.08 fib, and the $92.64 fib level. Upside trajectories range from the $154.88 fib up towards the $193.42 fib level.


