- Online prices in April 2022 up 2.9% on annual basis, dropping 0.5% month-over-month
- Over half of the 18 product categories tracked by Adobe saw price decreases
- $77.8 billion was spent online in April, over $5.28 billion less than the prior month
Adobe (Nasdaq:ADBE) today announced the latest online inflation data from the Adobe Digital Price Index (DPI), powered by Adobe Analytics. In April 2022, online prices increased 2.9% year-over-year (YoY), down from the record 3.6% YoY increase in March – a decrease of 0.5% month-over-month (MoM). While this marks the 23rd consecutive month of inflation online YoY, April shows early signs of online price increases beginning to slow. Over half of the categories tracked by the DPI (10 out of 18) saw MoM price decreases in April.
This press release features multimedia. View the full release here: https://www.businesswire.com/news/home/20220511005378/en/
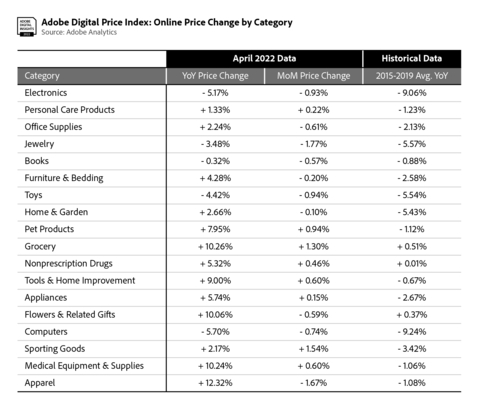
Price Table (Graphic: Business Wire)
Prices for electronics were down 5.2% YoY (down 0.9% MoM), a record YoY low for the category over the last 12 months. Prices for apparel increased 12.3% YoY, while decreasing 1.7% MoM. Although this is the highest YoY increase of any category, it is down from recent highs (February at 16.7% YoY and March at 16.3% YoY). Prices have not eased for groceries, rising 10.3% YoY (up 1.3% MoM) as well as pet products, which rose 8.0% YoY (up 0.9% MoM), record YoY highs for both categories.
In April, consumers spent $77.8 billion online, which represents modest growth at 4.5% YoY. Online spending in the U.S. grew double digits at 12.2% YoY ($71 billion) in January and 15.5% ($67 billion) in February. Consumer spending in April is also below the $83.08 billion spent in March, representing a 6.8% decline MoM or $5.28 billion. With rising interest rates and persistent inflation, consumers have pulled back on spending for durable goods.
“As the cost of borrowing and economic uncertainty rises for consumers, we are beginning to see the early impact on both online inflation and spend,” said Patrick Brown, vice president of growth marketing and insights, Adobe. “However, durable demand for e-commerce still drove over $77 billion in spend last month, as consumers continue to embrace the ease of online shopping and more personalized customer experiences in the digital economy.”
The DPI provides the most comprehensive view into how much consumers pay for goods online. Powered by Adobe Analytics, it analyzes one trillion visits to retail sites and over 100 million SKUs across 18 product categories: electronics, apparel, appliances, books, toys, computers, groceries, furniture/bedding, tools/home improvement, home/garden, pet products, jewelry, medical equipment/supplies, sporting goods, personal care products, flowers/related gifts, non-prescription drug and office supplies.
In April, 13 of the 18 categories tracked by the DPI saw YoY price increases, with apparel rising the most. Price drops were observed in five categories: electronics, jewelry, books, toys and computers.
Eight of the 18 categories in the DPI saw price increases MoM. Price drops were observed across 10 categories including electronics, office supplies, jewelry, books, furniture/bedding, toys, home/garden, flowers/related gifts, computers and apparel.
Notable categories in the Adobe Digital Price Index for April:
- Electronics: Prices were down 5.2% YoY (down 0.9% MoM). This is the largest YoY drop for the category since November 2020 (In October 2020, prices were down 6.2% YoY). As the biggest category in e-commerce by share of spend, price movements have an outsized impact on overall inflation online.
- Computers: Prices were down 5.7% YoY (down 0.7% MoM). This is the 16th consecutive month of deflation for the category, after rising 2.9% YoY in December 2020. The price decrease is still below historical levels, however, with computer prices dropping 9.2% YoY on average (from 2015 to 2019).
- Apparel: Prices were up 12.3% YoY (down 1.7% MoM). While the category has now seen over a year of online inflation (13 months), there are signs that prices are beginning to ease. From November 2021 to March 2022, prices increased by more than 15.7% YoY each month, well above the 12.3% YoY in April.
- Groceries: Prices continued to surge and rose 10.3% YoY (up 1.3% MoM), setting another new record on an annual basis. This follows a 9.0% YoY increase in March, a 7.6% YoY increase in February and a 5.8% YoY increase in January—all record highs. Groceries remains the only category to move in lockstep with the CPI on a long-term basis, with online prices rising now for 27 consecutive months.
- Pet Products: Prices were up 8.0% YoY (up 0.9% MoM), the highest increase for the category YoY. Online inflation for pet products has now been observed for two full years, with the previous high point in September 2020 (up 7.8% YoY).
Methodology
The DPI is modeled after the Consumer Price Index (CPI), published by the U.S. Bureau of Labor Statistics and uses the Fisher Price Index to track online prices. The Fisher Price Index uses quantities of matched products purchased in the current period (month) and a previous period (previous month) to calculate the price changes by category. Adobe’s analysis is weighted by the real quantities of the products purchased in the two adjacent months.
Powered by Adobe Analytics, Adobe uses a combination of Adobe Sensei, Adobe’s AI and machine learning framework, and manual effort to segment the products into the categories defined by the CPI manual. The methodology was first developed alongside renowned economists Austan Goolsbee and Pete Klenow.
About Adobe
Adobe is changing the world through digital experiences. For more information, visit www.adobe.com.
© 2022 Adobe. All rights reserved. Adobe and the Adobe logo are either registered trademarks or trademarks of Adobe in the United States and/or other countries. All other trademarks are the property of their respective owners.
View source version on businesswire.com: https://www.businesswire.com/news/home/20220511005378/en/
Contacts
Public relations contacts
Kevin Fu
Adobe
kfu@adobe.com
Bassil Elkadi
Adobe
belkadi@adobe.com


