- Groceries now a major category online, expected to top $85 billion in online sales in 2022
- With inflation, U.S. consumers paid $32 billion more for the same amount of goods
- “Buy Now Pay Later” and curbside pickup continue to reshape online shopping
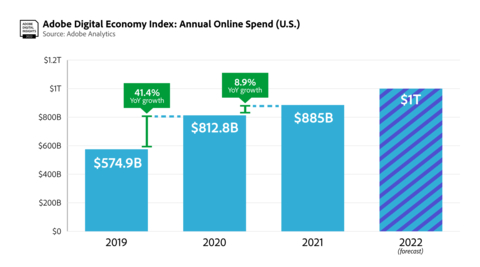
- U.S. consumers to spend over $1 trillion online in 2022, a new record
At Adobe Summit, Adobe (Nasdaq:ADBE) today released new U.S. e-commerce data looking at how two years of COVID-19 reshaped the digital economy and its impact on the future.
This press release features multimedia. View the full release here: https://www.businesswire.com/news/home/20220315005468/en/
(Graphic: Business Wire)
After two years of the pandemic (March 2020 through February 2022), U.S. consumers spent $1.7 trillion online, $609 billion more than the two preceding years. Demand remained strong in 2021 with $885 billion in online spend, up 8.9% year-over-year (YoY). As the digital economy shifts to more personalized customer experiences, Adobe expects the annual online spend in the U.S. to surpass $1 trillion for the first time in 2022. And as the digital economy expands, new Adobe data reveals trends and new consumer shopping behaviors:
Inflation Contributes to E-Commerce Growth
Of the $1.7 trillion spent by consumers, $32 billion was driven by higher prices. In other words, consumers paid $32 billion more for the same amount of goods. Online inflation, first observed in June 2020, has persisted for 21 consecutive months. The impact was most notable in 2021, where $22 billion of e-commerce growth was driven by higher prices compared to just $4.7 billion in 2020.
In the first two months of 2022, $3.8 billion in e-commerce growth was driven by higher prices. Inflation has not deterred demand, however, with the same two months driving $138 billion in online spend, up 13.8% YoY. In 2022, Adobe expects consumers could pay as much as $27 billion more online for the same amount of goods due to inflation.
Groceries Become a Major E-Commerce Category
In 2021, 41.8% of e-commerce overall was driven by just three categories: groceries, electronics and apparel. The pandemic has impacted the trajectory of each one:
- Groceries: 2020 was a breakout year for the category, with $73.7 billion spent online, surging 103% YoY ($79.2 billion in 2021, up 7.2% YoY). Groceries is now 8.9% of the e-commerce share overall, up from 6.3% in 2019 and down slightly from 2020 (9.1%) when demand surged early in the pandemic. Consumers now spend an average of $6.7 billion each month for groceries, up from $3.1 billion pre-pandemic. Adobe expects the category to top $85 billion in 2022.
- Electronics: As the largest e-commerce category, electronics drove $165 billion in online spend in 2021, up 8% YoY. This represents an 18.6% share of e-commerce overall, down slightly from 2020 (18.8%) and 2019 (21%) as other categories grew. The pandemic cemented electronics as the top category, with consumers spending $152.7 billion in 2020, up a significant 26.8% YoY. U.S. consumers now spend an average of $13.6 billion each month for electronics, up from $9.9 billion pre-pandemic. Adobe expects the category to top $174 billion in 2022.
- Apparel: As consumers spent more time at home, apparel demand slumped. In 2020, apparel grew by 9.1% YoY ($115.8 billion) as e-commerce overall grew by 41% YoY. Growth was modest in 2021 at $126.2 billion, up 8% YoY. This represents a 14.3% of e-commerce share overall, down from 2019 (18.5%) and in line with 2020 (14.2%). Pre-pandemic, apparel spend in 2019 was $14.4 billion behind electronics. By 2021, the gap widened to $38.8 billion. Apparel is still a major category, with consumers spending an average of $10.2 billion each month, up from $8.7 billion pre-pandemic. Adobe expects the category to top $130 billion in 2022.
“E-commerce is being reshaped by grocery shopping, a category with minimal discounting compared to legacy categories like electronics and apparel,” said Patrick Brown, vice president of growth marketing and insights, Adobe. “It highlights a shift in the digital economy, where speed and convenience are becoming just as important as cost savings.”
Additional Insights
- Out-of-Stock: Consumers have seen 60 billion out-of-stock (OOS) messages in the last 24 months (March 2020 to February 2022), in the face of supply chain constraints. The odds of seeing an OOS message are now one in 59 pages, up from one in 200 pages pre-pandemic (a 235% increase). In the last four months (November 2021 through February 2022), consumers have seen over 12 billion OOS messages, a trend expected to persist in 2022.
- Buy Now Pay Later (BNPL): As consumers spent more online during the pandemic and looked for new ways to manage their money, BNPL orders between October and November 2020 increased 528% YoY while revenue grew 412% YoY. In recent months, growth has slowed, but demand remained strong: BNPL orders are up 53% YoY while revenue is up 56% YoY.
- Curbside Pickup: The fulfillment method already saw strong adoption before the pandemic, but health and safety concerns gave it a boost. The demand has been durable, with many consumers now valuing the speed and convenience. In 2022 so far, curbside pickup accounted for 20% of all online orders (for retailers who offer the service), establishing itself as a major fulfilment method.
Methodology
The Adobe Digital Economy Index offers the most comprehensive set of insights of its kind, based on analysis through Adobe Analytics that covers over one trillion visits to U.S. retail sites and over 100 million SKUs in 18 product categories—more than any other technology company or research organization. Online inflation insights, from the Adobe Digital Price Index, is modeled after the Consumer Price Index (CPI), published by the U.S. Bureau of Labor Statistics, and uses the Fisher Price Index to track online prices. The Fisher Price Index uses quantities of matched products purchased in the current period (month) and a previous period (previous month) to calculate the price changes by category.
Adobe’s analysis is weighted by the real quantities of the products purchased in the two adjacent months. Adobe uses a combination of Adobe Sensei, Adobe’s AI and machine learning framework, and manual effort to segment the products into the categories defined by the CPI manual. The methodology was first developed alongside renowned economists Austan Goolsbee and Pete Klenow.
About Adobe
Adobe is changing the world through digital experiences. For more information, visit www.adobe.com.
© 2022 Adobe. All rights reserved. Adobe and the Adobe logo are either registered trademarks or trademarks of Adobe in the United States and/or other countries. All other trademarks are the property of their respective owners.
View source version on businesswire.com: https://www.businesswire.com/news/home/20220315005468/en/
Contacts
Public relations contact
Kevin Fu
Adobe
kfu@adobe.com


