The returns you get from investing do not mean much. That is, unless you know how much risk you took to achieve them. Because what worked in the past will only work in the future if two things are identical:
- Market conditions
- The level of risk you take on
It follows that if you don’t know how much risk you are taking, you may be walking blindly into the next stock bear market. Or, you might think you are diversified because you own many stocks, across many sectors and industries. The facts of today’s markets disagree with that thinking.
Here’s my evidence.
Risk Can Be Hidden in Plain Sight
In a market that often feels like a high-speed chase, the past 5 years have proven that you don't need a complex “stock picking” engine to come out ahead. While many investors spent thousands of hours analyzing balance sheets and chasing the next outlier, the evidence shows that a simpler, tactical approach — using just two exchange-traded funds (ETFs) and a disciplined risk score — actually produced superior risk-adjusted results.
Note that this has been a very good period for the “broad stock market” as judged by the S&P 500 Index’s ($SPX) 70% price increase over that period. The average S&P 500 stock is still up a solid 53% over that time.
I’ve spent a lot of time over the past year wondering aloud if we aren’t just all making this investing thing way too complicated.
So, I decided to challenge myself.
My goal was to see if I could prove that using just a handful of ETFs, and rotating their position sizes as market conditions shifted, I could get more “bang for my buck,” literally. Less work, fewer moves, similar returns.
I was wrong. I didn’t need 5 ETFs. I only needed 2!
Here’s the test I used to convince myself. The strategy is built on a straightforward foundation:
- A tactical mix of the SPDR S&P 500 ETF (SPY) and the SPDR Bloomberg 1-3 Month T-Bill ETF (BIL). I own both nearly all the time.
- The weightings between those two ETFs is governed by the Reward Opportunity and Risk (ROAR) Score, my proprietary risk-measuring statistic. However, I’ll quickly point out that the active methodology here is an individual decision. So is the choice to have the position sizes of SPY and BIL fluctuate over time, as I prefer.
- In my case, using the ROAR system, the key is the score of SPY. When the score is high, that implies lower than average risk, and thus a higher allocation to SPY. When risk flashes red, the position in BIL increases, and the SPY allocation is lower. For instance, as of Monday morning, SPY was just 20% of this simple 2-ETF portfolio, while the other 80% was in BIL.
The Math of Efficiency vs. The Ego of Selection
I ran that portfolio back 5 years, adjusting the ROAR Score of SPY every Tuesday night, thus assuming that each Wednesday morning, if there was a change in the score, the adjusting trades would have occurred.
The results of this two-ETF mix compared to the Invesco S&P 500 Equal Weight ETF (RSP) are telling. While RSP is often touted as a way to “beat the market” by reducing concentration risk, it still forces investors to capture 100% of every market downturn. And since 25 stocks now comprised nearly half the S&P 500, the mediocre performance of the other 475 has been masked by the Magnificent 7’s dominance.
Here’s a graph comparing my risk-managed SPY/BIL portfolio to RSP.
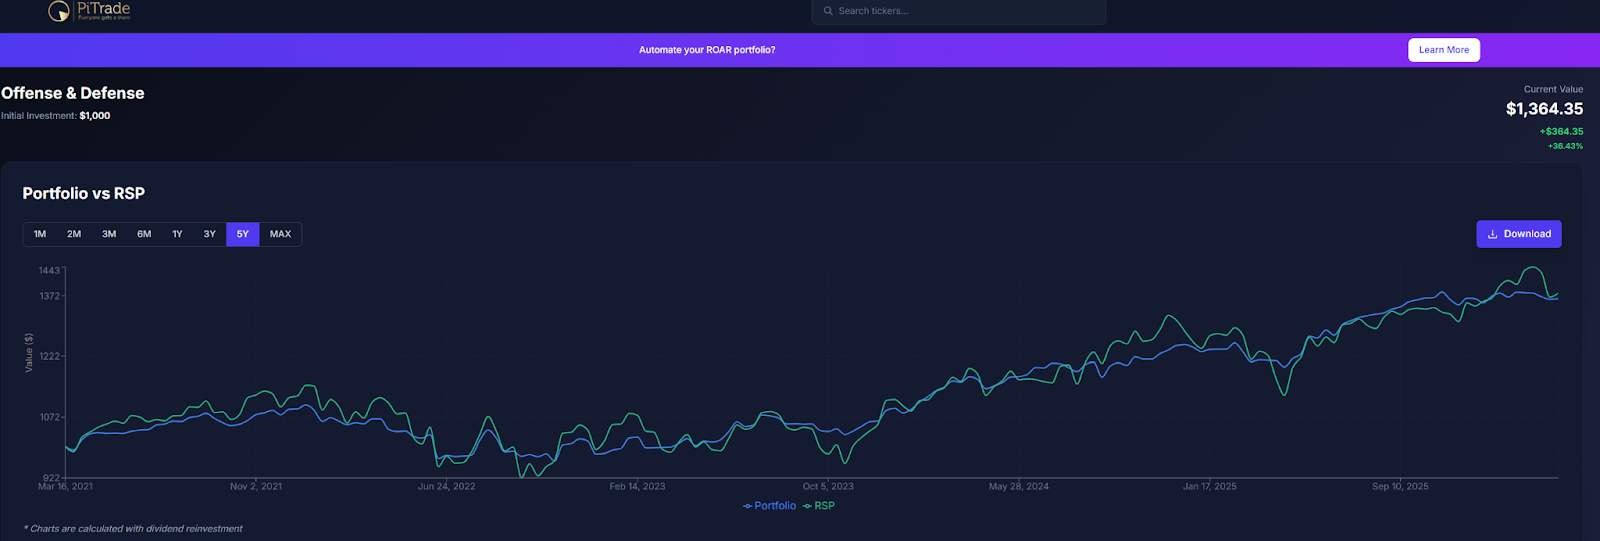
Here’s a summary of key performance metrics over this 5-year period:
The 2-ETF portfolio produced an annualized return of 6.4%, nearly matching RSP’s 6.6%. However, the real story is in the risk profile:
- Max Drawdown: The portfolio’s worst drop was only -12.6%, compared to a painful -19.9% for RSP.
- Sharpe Ratio: the 2-ETF simple mix has a ratio of 2.1, nearly double RSP’s. Translation: significantly more return per unit of risk taken.
- Downside Capture: The portfolio only captured 33% of the market’s downward moves while participating in 43% of the upside.
Why ‘Non-Core’ Stock Picking Often Fails
The primary reason this simple mix outperformed on a risk-adjusted basis is that it avoids the trap of mid-tier and non-core stocks. The markets are now so widely controlled by algorithms and indexing, there’s far less room for a single stock of modest size to rally for too long. And for every one that does, there’s likely another one in the portfolio basket that gives a lot of that return back. This is the era where the index a stock is in matters just as much as what business it is in.
The evidence suggests that for most investors, the homework of individual stock picking is often just busywork. When we realize that most stocks are not worth the risk, you stop trying to find the “needle” and start focusing on the “haystack” that actually matters.
Now, by no means am I dismissing stock selection entirely. I’m writing to the masses here, and my observation is that learning how to invest is made much more difficult when we feel inundated with stats, facts, and opinions.
I’ll conclude with an estimate: I think 80% of investors could identify two ETFs, one for “offense” and one for “defense,” allocate and rotate between them, and produce results across a full market cycle that can rival the most intricate concoctions of professionally created portfolios.
This is not a knock on anyone. It is a recognition that the modern stock market is no longer a market at all. It is, in large part, a single “risk on/risk off trade.” We can operate with that in mind, or pretend we’re still investing in the 20th century. I know my choice, and I will continue to write about it frequently.
Rob Isbitts created the ROAR Score, based on his 40+ years of technical analysis experience. ROAR helps DIY investors manage risk and create their own portfolios. For Rob's written research, check out ETFYourself.com.
On the date of publication, Rob Isbitts did not have (either directly or indirectly) positions in any of the securities mentioned in this article. All information and data in this article is solely for informational purposes. For more information please view the Barchart Disclosure Policy here.
More news from Barchart
- 1 Under-the-Radar Stock That Insiders Are Buying Up Now
- The Market About Nothing: Why Stocks Are Stuck in a Seinfeld-Style Loop and How to Play It From Here
- CoreWeave Stock Is Up 105% in a Year. Can It Soar to $180?
- Airline Stocks Have Been Hard Hit by Iran War, but Citi Is Betting Big on These 2 Names


