Two-sided online marketplace operator Etsy, Inc. (ETSY) enjoys robust profitability despite broad macroeconomic concerns. Its trailing-12-month gross profit margin and levered FCF margin of 70.81% and 21.43% are 100.9% and 479.1% higher than the industry averages of 35.25% and 3.70%, respectively.
However, its bottom line performance in the first quarter (ended March 31) is concerning. Its net income declined 13.4% year-over-year to $74.54 million. Also, the company’s net income per share attributable to common shareholders came in at $0.53, down 11.7% year-over-year.
Given this backdrop, let’s look at the trends of ETSY’s key financial metrics to understand why it might be wise to wait for a better entry point in the stock.
Analyzing Etsy’s Financial Performance: Net Income Declines Amid Revenue Growth
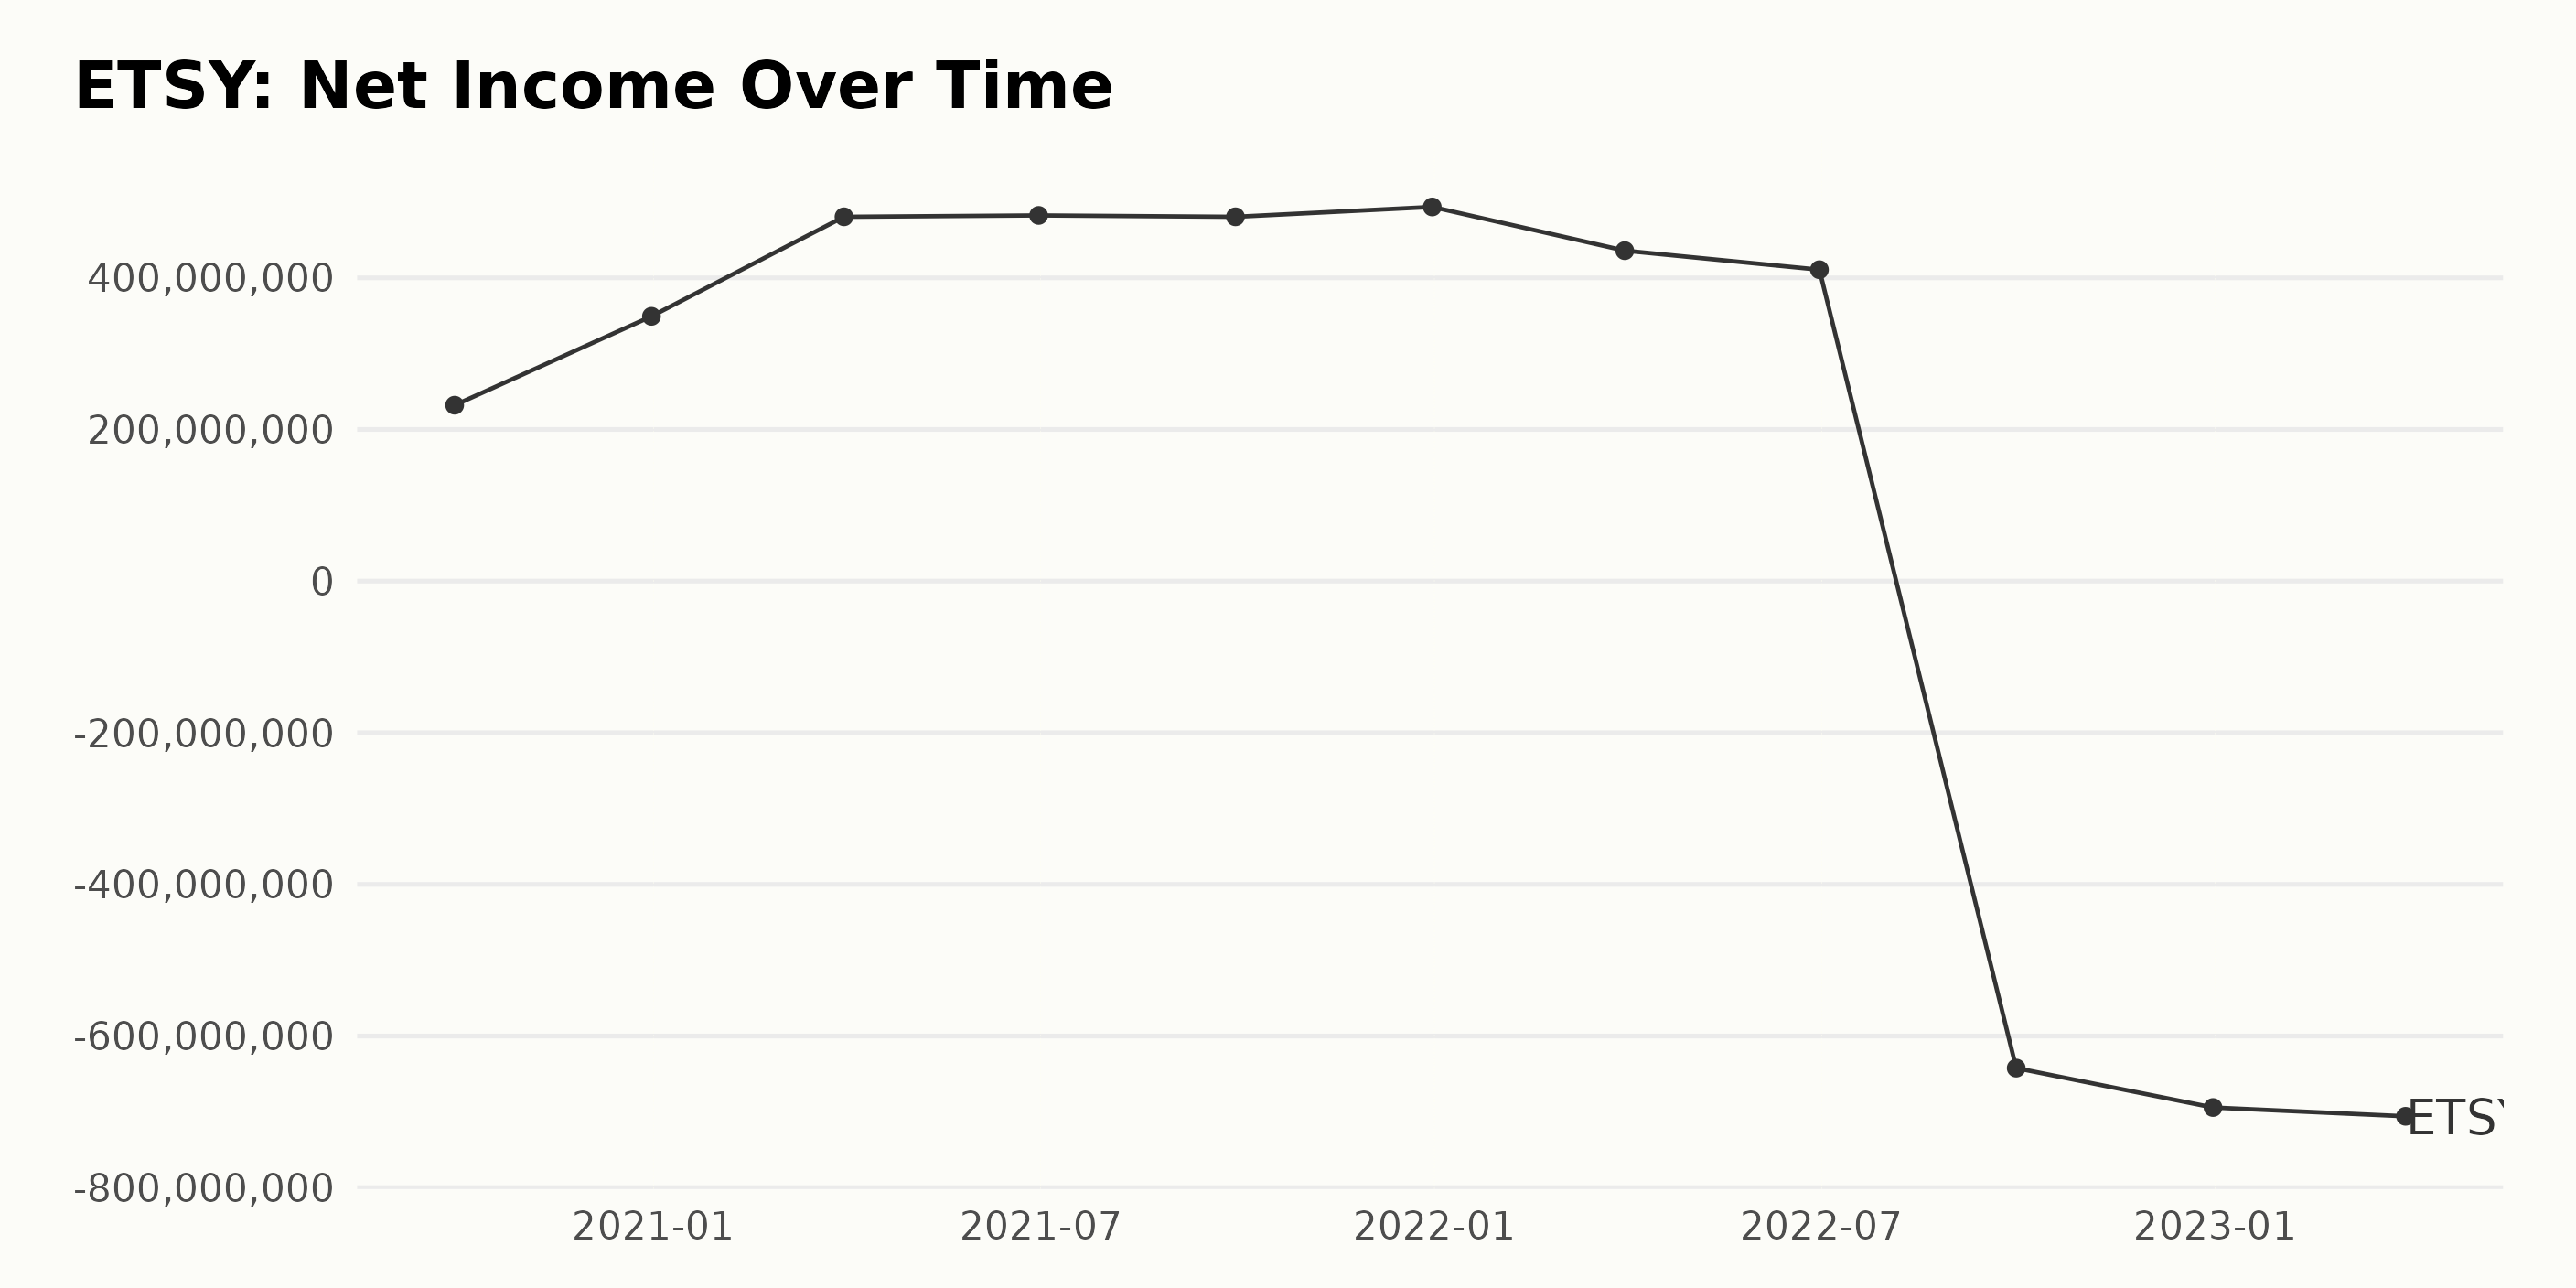
The data series presents an upward trend of ETSY’s trailing-12-month net income from September 2020 to December 2021, followed by a sharp decline in 2022 and 2023.
- Net income started rising from $232 million in September 2020.
- In December 2020, it grew to $349.25 million, further increasing to $480.49 million by March 2021.
- There was a slight increase to $482.32 million in June 2021 and a leveling off at $480.49 million in September 2021.
- Slight growth continued until December 2021, when net income peaked at $493.51 million. Starting from the first quarter of 2022, ETSY started experiencing a downturn.
- In March 2022, net income decreased to $435.85 million.
- A further decrease was noted in June 2022 to $410.72 million.
- A significant drop to -$642.28 million occurred in September 2022, implying a substantial loss.
- This downward trend continued until March 2023, when the net income registered its lowest value of -$705.86 million.
In terms of growth rate, ETSY experienced an increase from $232 million in September 2020 to a peak of $493.51 million in December 2021. However, 2022 started with a string of losses, leading to a drastic decrease in net income to -$705.86 million as of March 2023. In terms of comparing the last value against the first, this represents a significant negative growth.
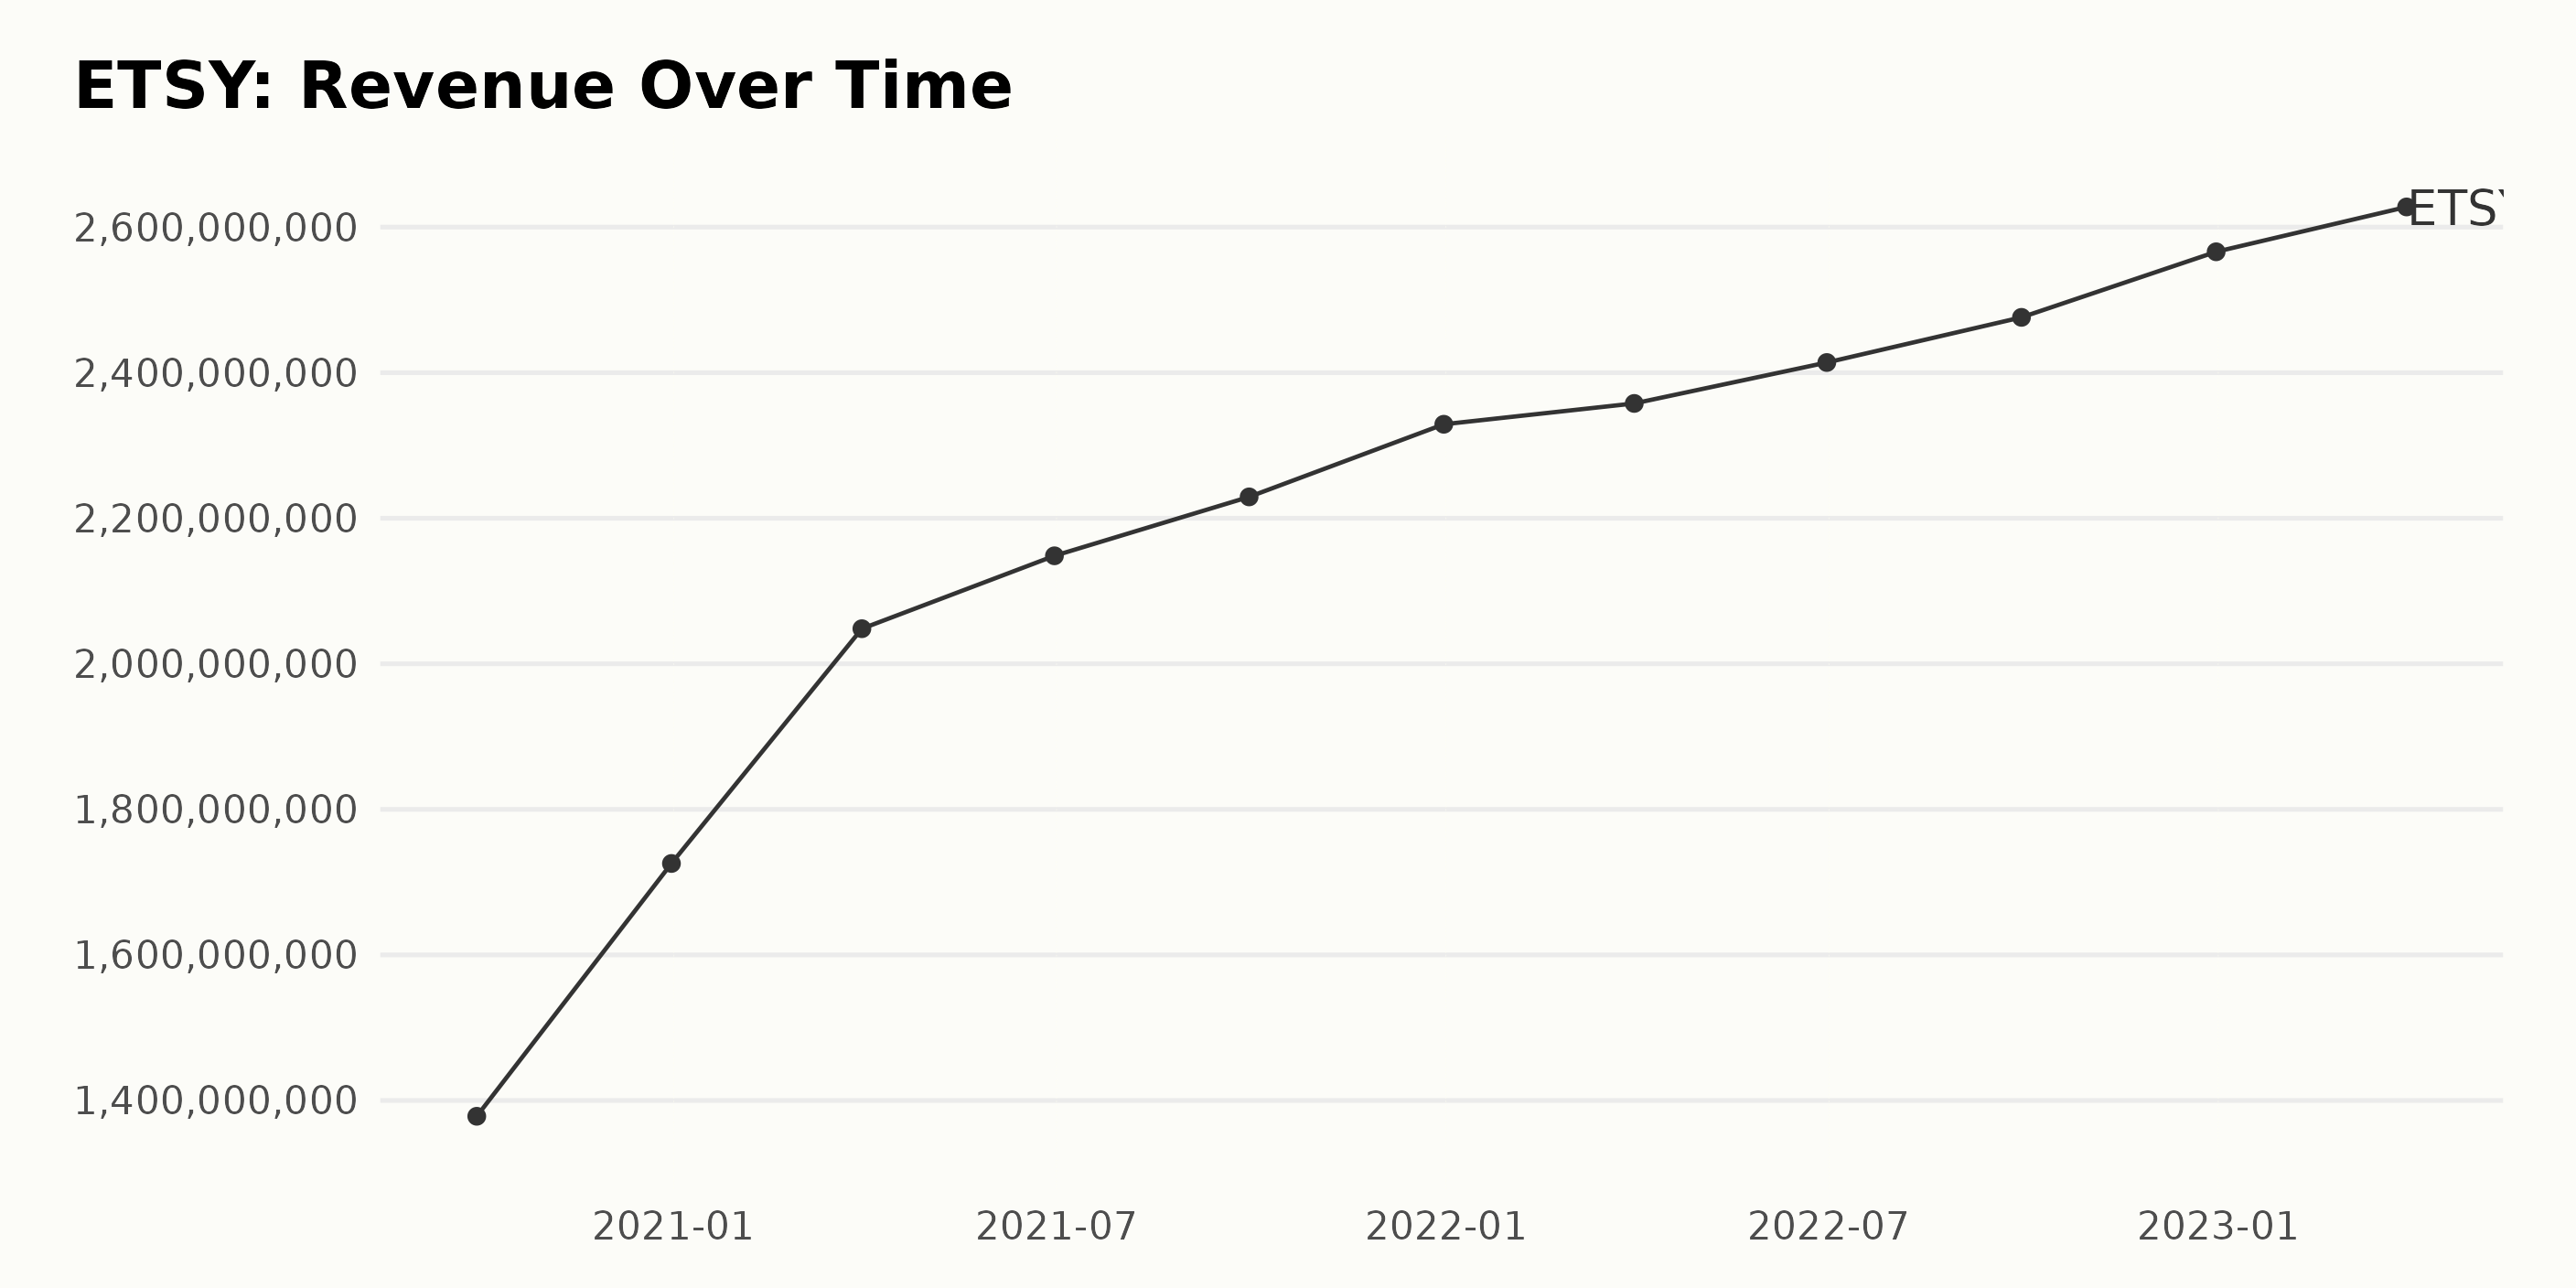
The trailing-12-month revenue of ETSY has exhibited a consistent upward trend over the span of the data series from September 30, 2020, to March 31, 2023.
- On September 30, 2020, the revenue was reported at $1.38 billion.
- By the end of 2020, on December 31, the revenue increased to $1.73 billion.
- Revenue continued to grow steadily throughout 2021, crossing the $2 billion mark by its first quarter and finally closing the year at $2.33 billion in December.
- The growth remained persistent through 2022, reaching $2.47 billion by its third quarter (September 30, 2022) and rounding off the year with a further increase to $2.57 billion in December.
- As of the latest value in the series, on March 31, 2023, ETSY’s revenue reached $2.63 billion.
The data reveals a few fluctuations, but these are minor when viewed against the broader steady increase in revenue. Overall, the growth appears to be consistent and progressive. From the first value of $1.38 billion in September 2020 to the last value of $2.63 billion in March 2023, ETSY's revenue grew by approximately 90.42%. Hence, emphasizing the continuous positive trend in the company's revenue generation.
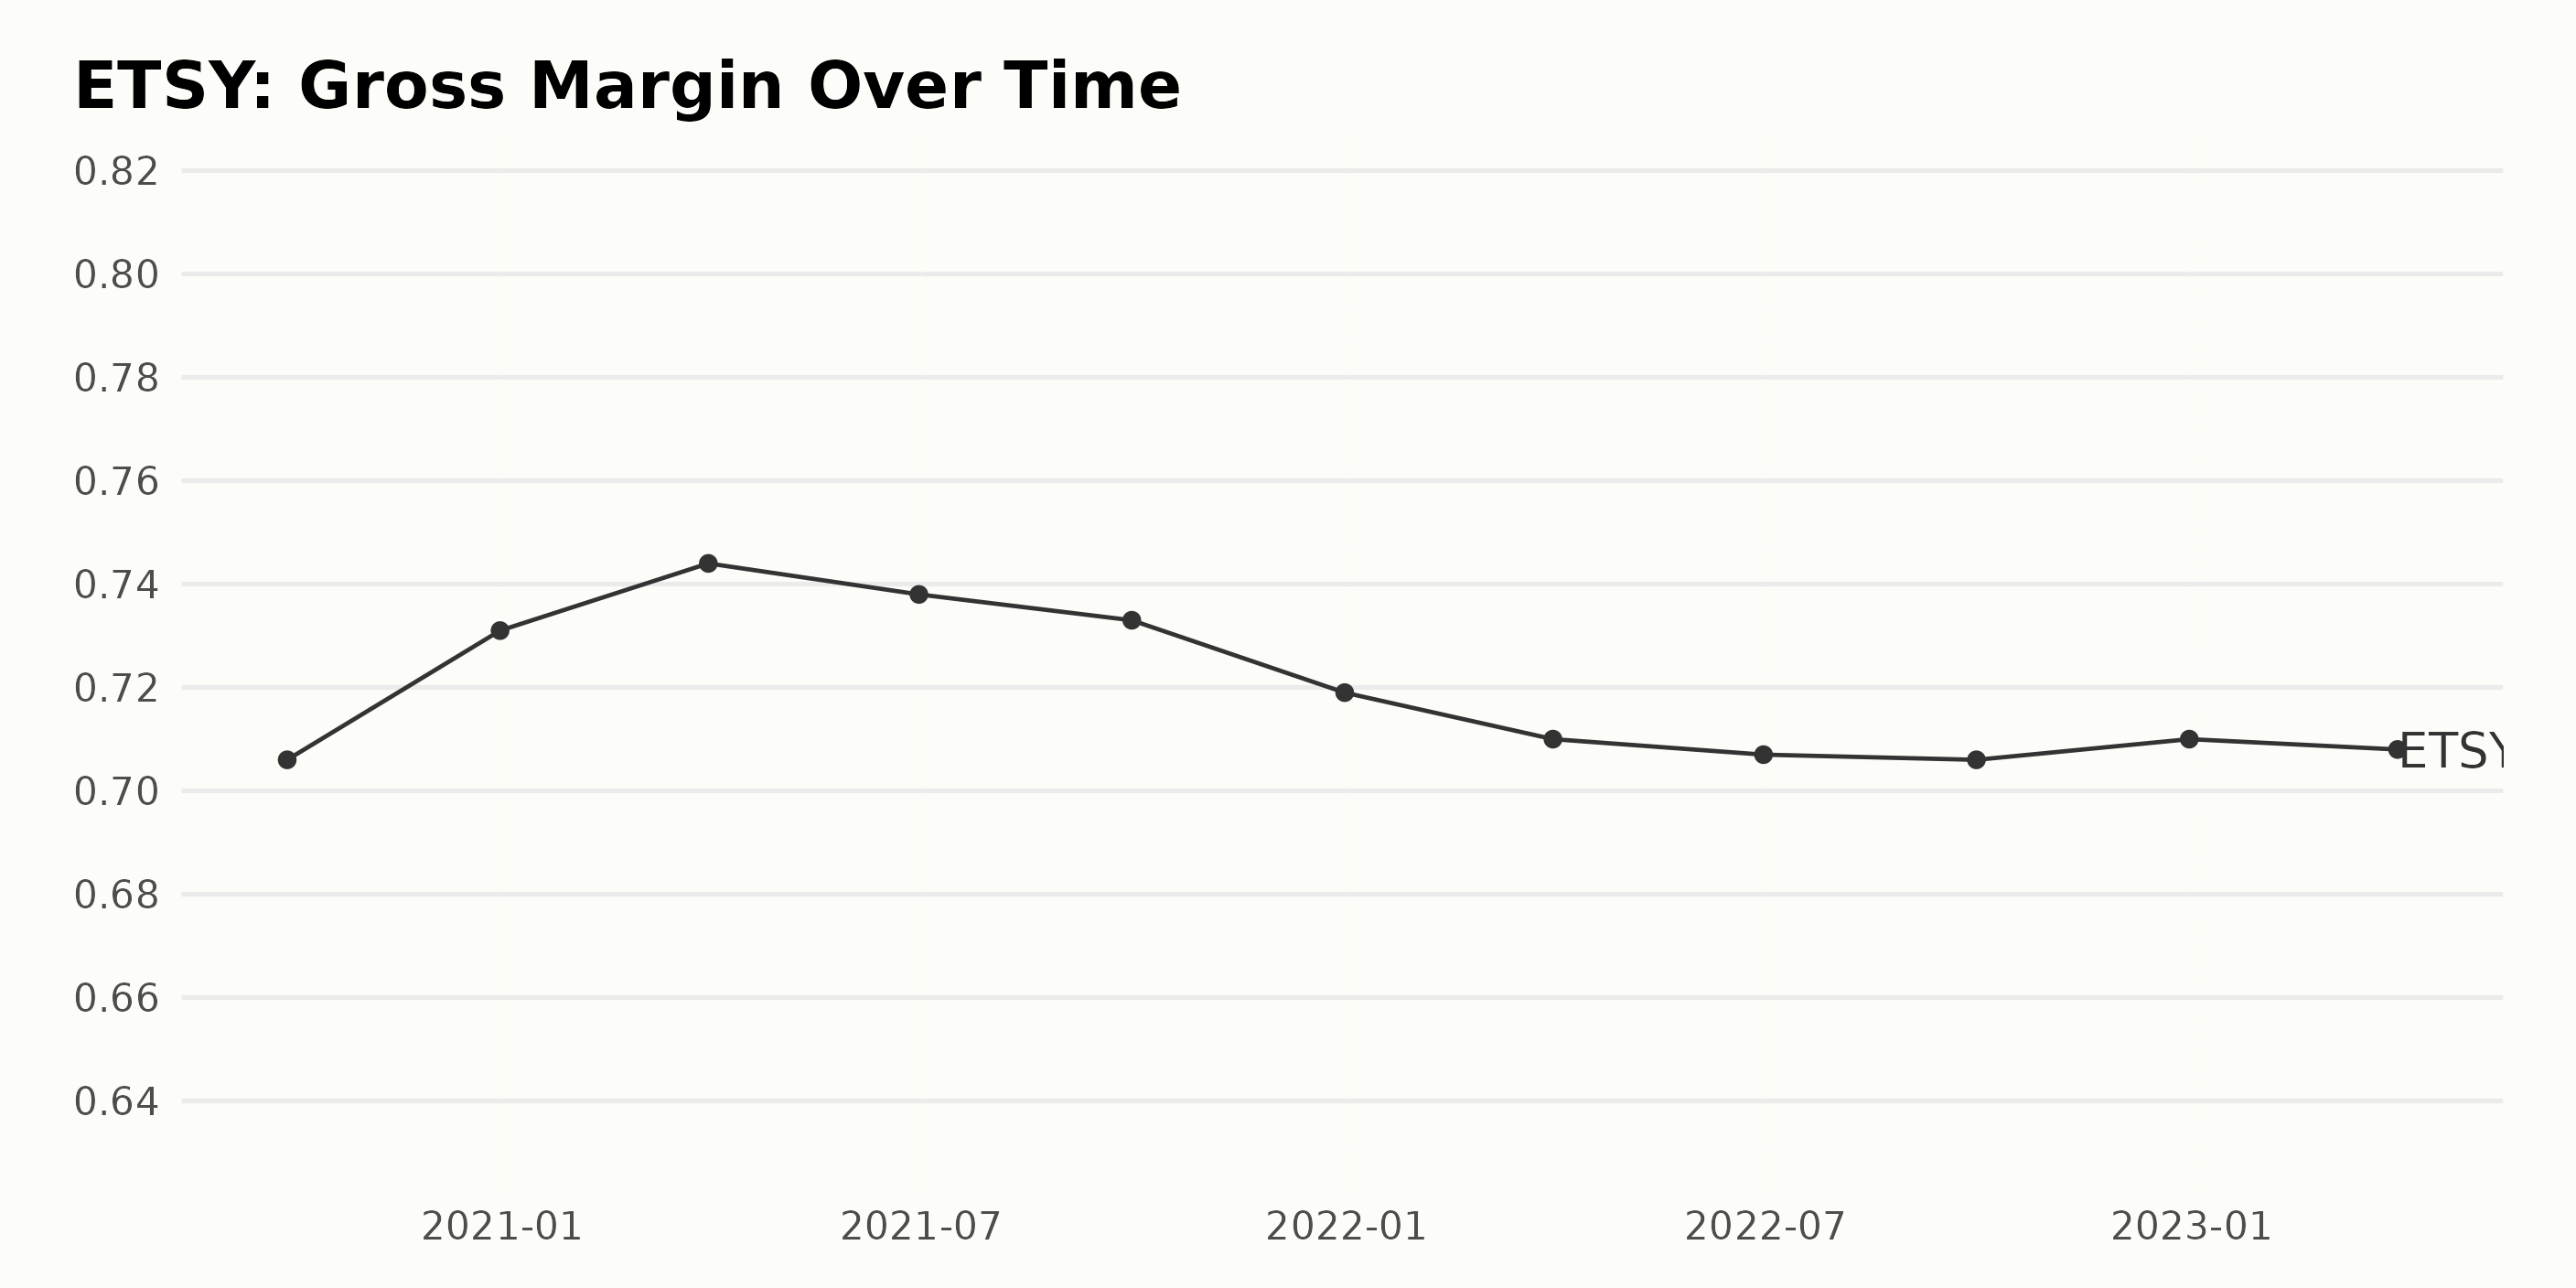
Through a comprehensive analysis of the gross margin of ETSY, certain trends and fluctuations have been identified over a time frame spreading from September 30, 2020, to March 31, 2023.
- Starting September 30, 2020, ETSY reported a gross margin of 70.6%.
- The gross margin elevated to 73.1% by December 31, 2020.
- Subsequently, on March 31, 2021, it witnessed a marginal increase, reaching a peak of 74.4%.
- Over mid-2021, it observed a minor fluctuation, initially decreasing to 73.8% as of June 30 and further coming down to 73.3% by September 30.
- By the end of 2021, there was a notable drop, with the gross margin falling to 71.9%.
- The gross margin in 2022 experienced further slight decreases, with the values being 71% as of March 31, 70.7% by June 30, and finally falling to its initial level, i.e., 70.6% as of September 30.
- A modest rebound was seen at the end of 2022, with the gross margin scaling back to 71%.
- In early 2023, the gross margin decreased slightly to 70.8%.
Upon evaluating the initial and final points in the series, the gross margin has exhibited an overall growth rate of approximately 0.28% during this duration. While the gross margin data for ETSY has seen relatively small-scale fluctuation, the focus remains on the recent data, which depicts a slight upwards trend since September 2022.
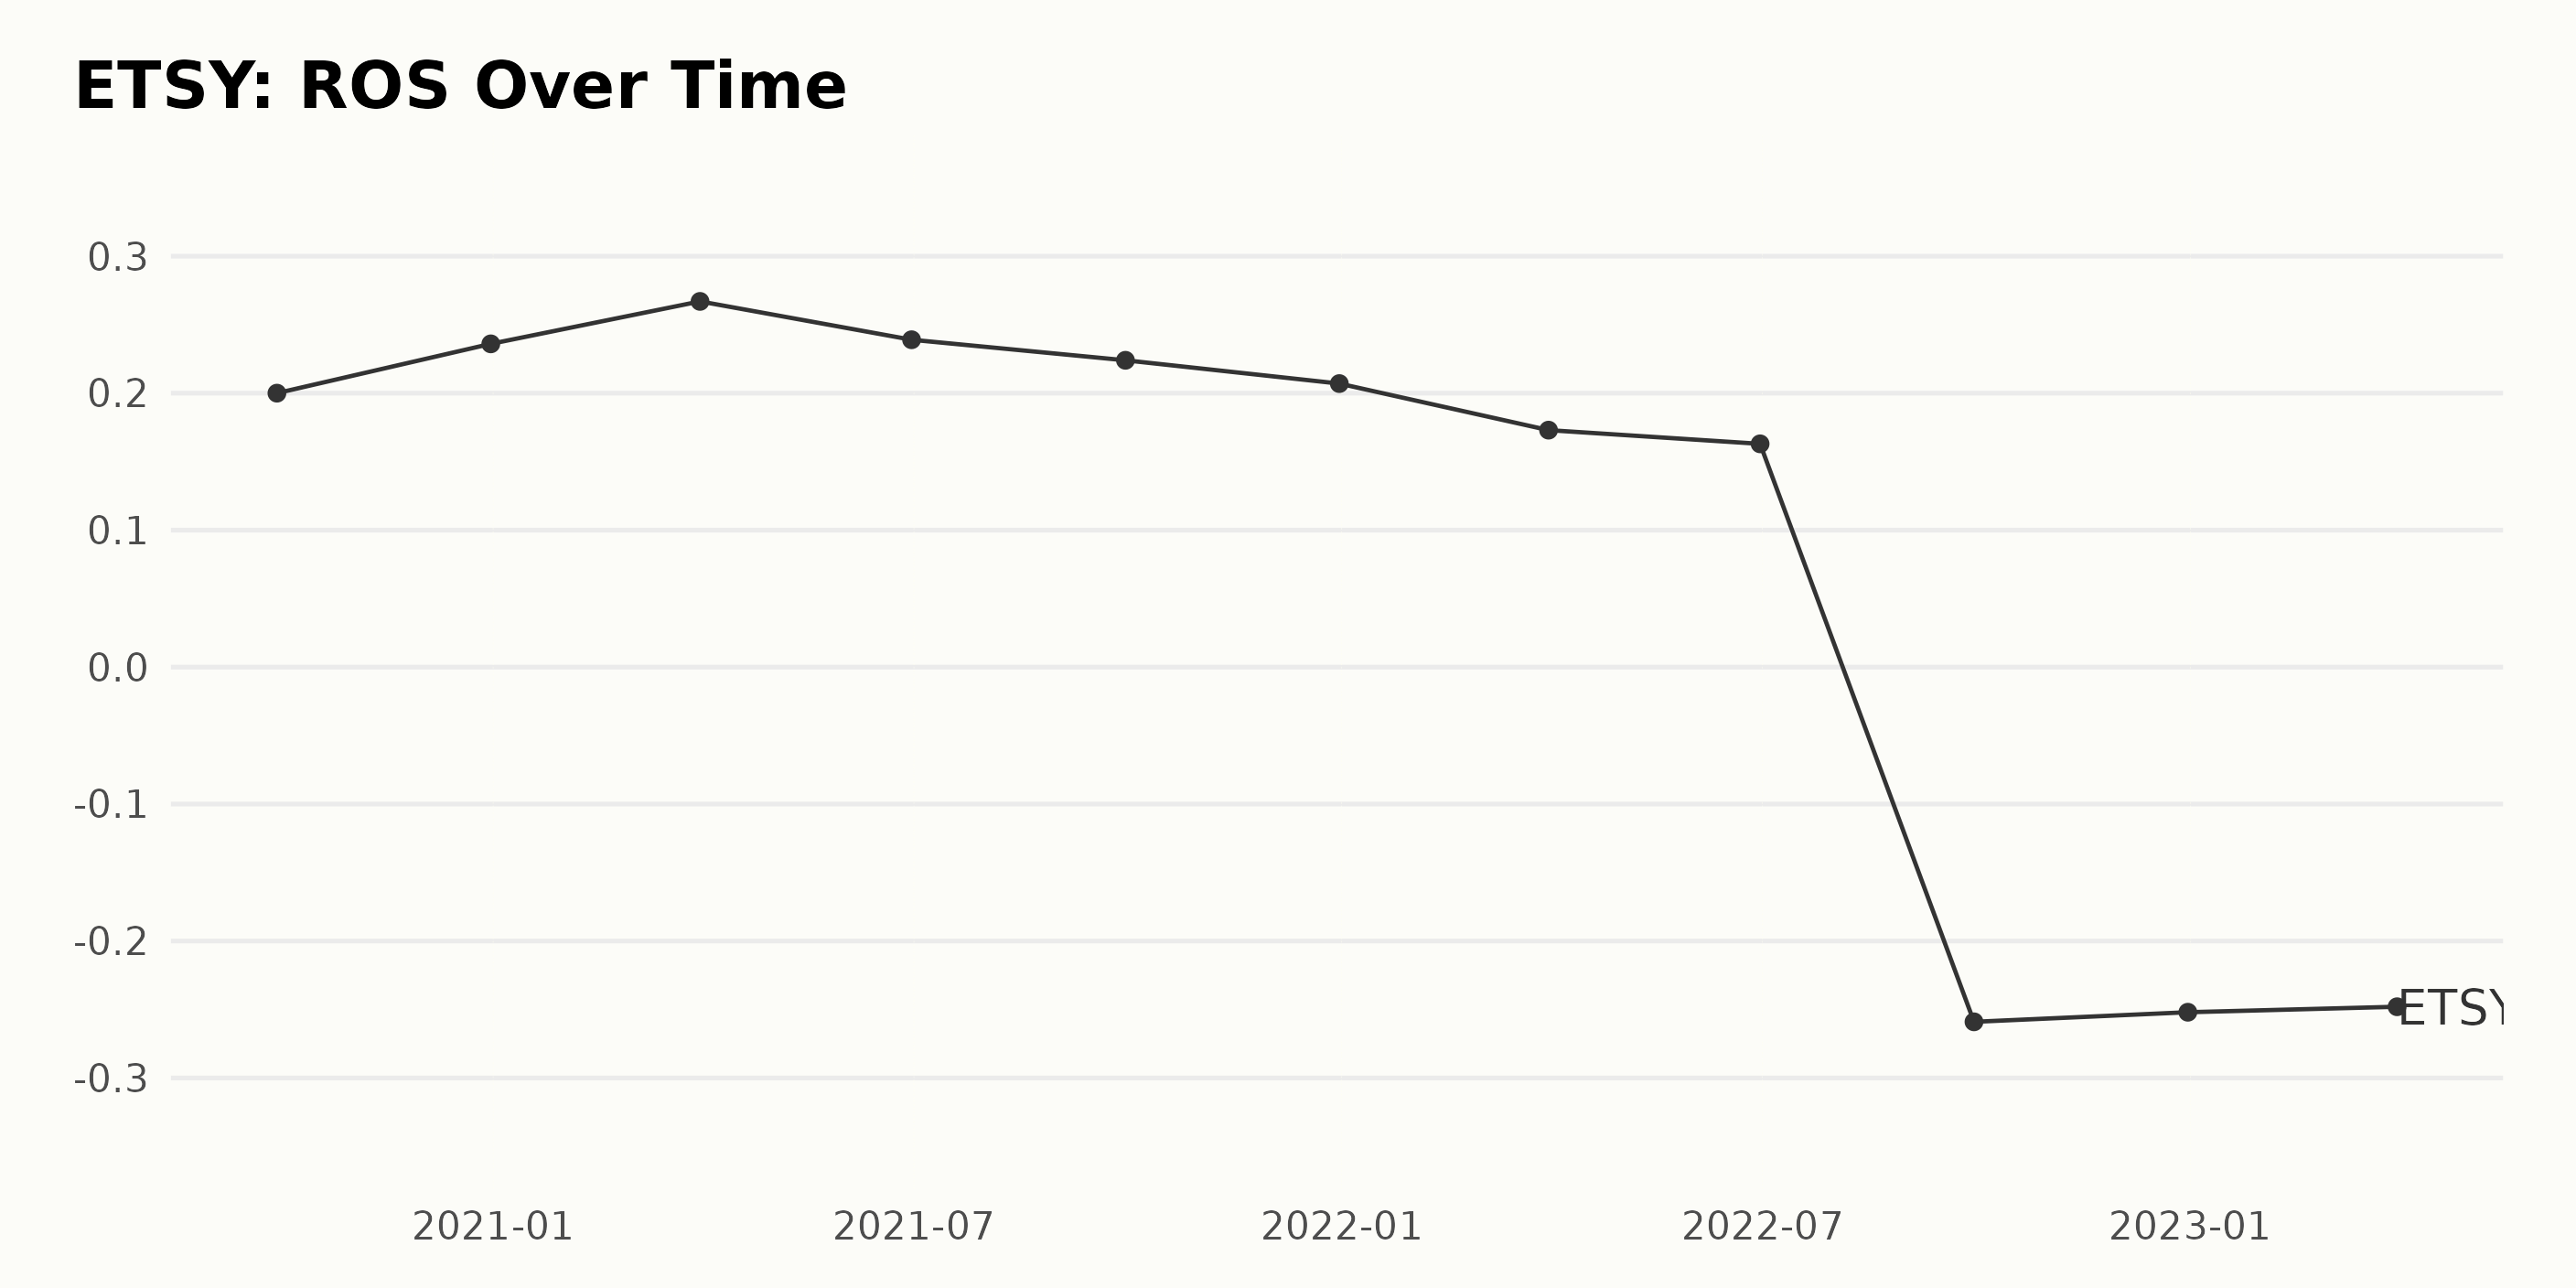
The data series reveals the trend and fluctuations in ETSY's Return On Sales (ROS) over a specified period. A summarized overview is as follows:
- In the third quarter of 2020, ETSY recorded a ROS of 0.20.
- There was a steady increase in the following quarters, with a ROS of 0.24 and 0.27 at the end of 2020 and the first quarter of 2021, respectively.
- The second quarter of 2021 saw a slight dip to 0.24. However, the ROS dropped further to 0.22 by the end of the third quarter of 2021.
- The decrease continued until the end of 2021, with the ROS standing at 0.21 by December 31, 2021.
- The first half of 2022 indicated a declining trend, with ROS values of 0.17 and 0.16 in the first and second quarters, respectively.
- A drastic decline in ROS was observed in the third quarter of 2022, with a negative value of -0.26. This downward trend continued to the last date in the series, March 31, 2023, when the ROS stood at -0.25.
Comparing the initial value (0.20 on September 30, 2020) with the last value (-0.25 on March 31, 2023), there's been a significant fall in the ROS, indicating a negative growth rate over this period.
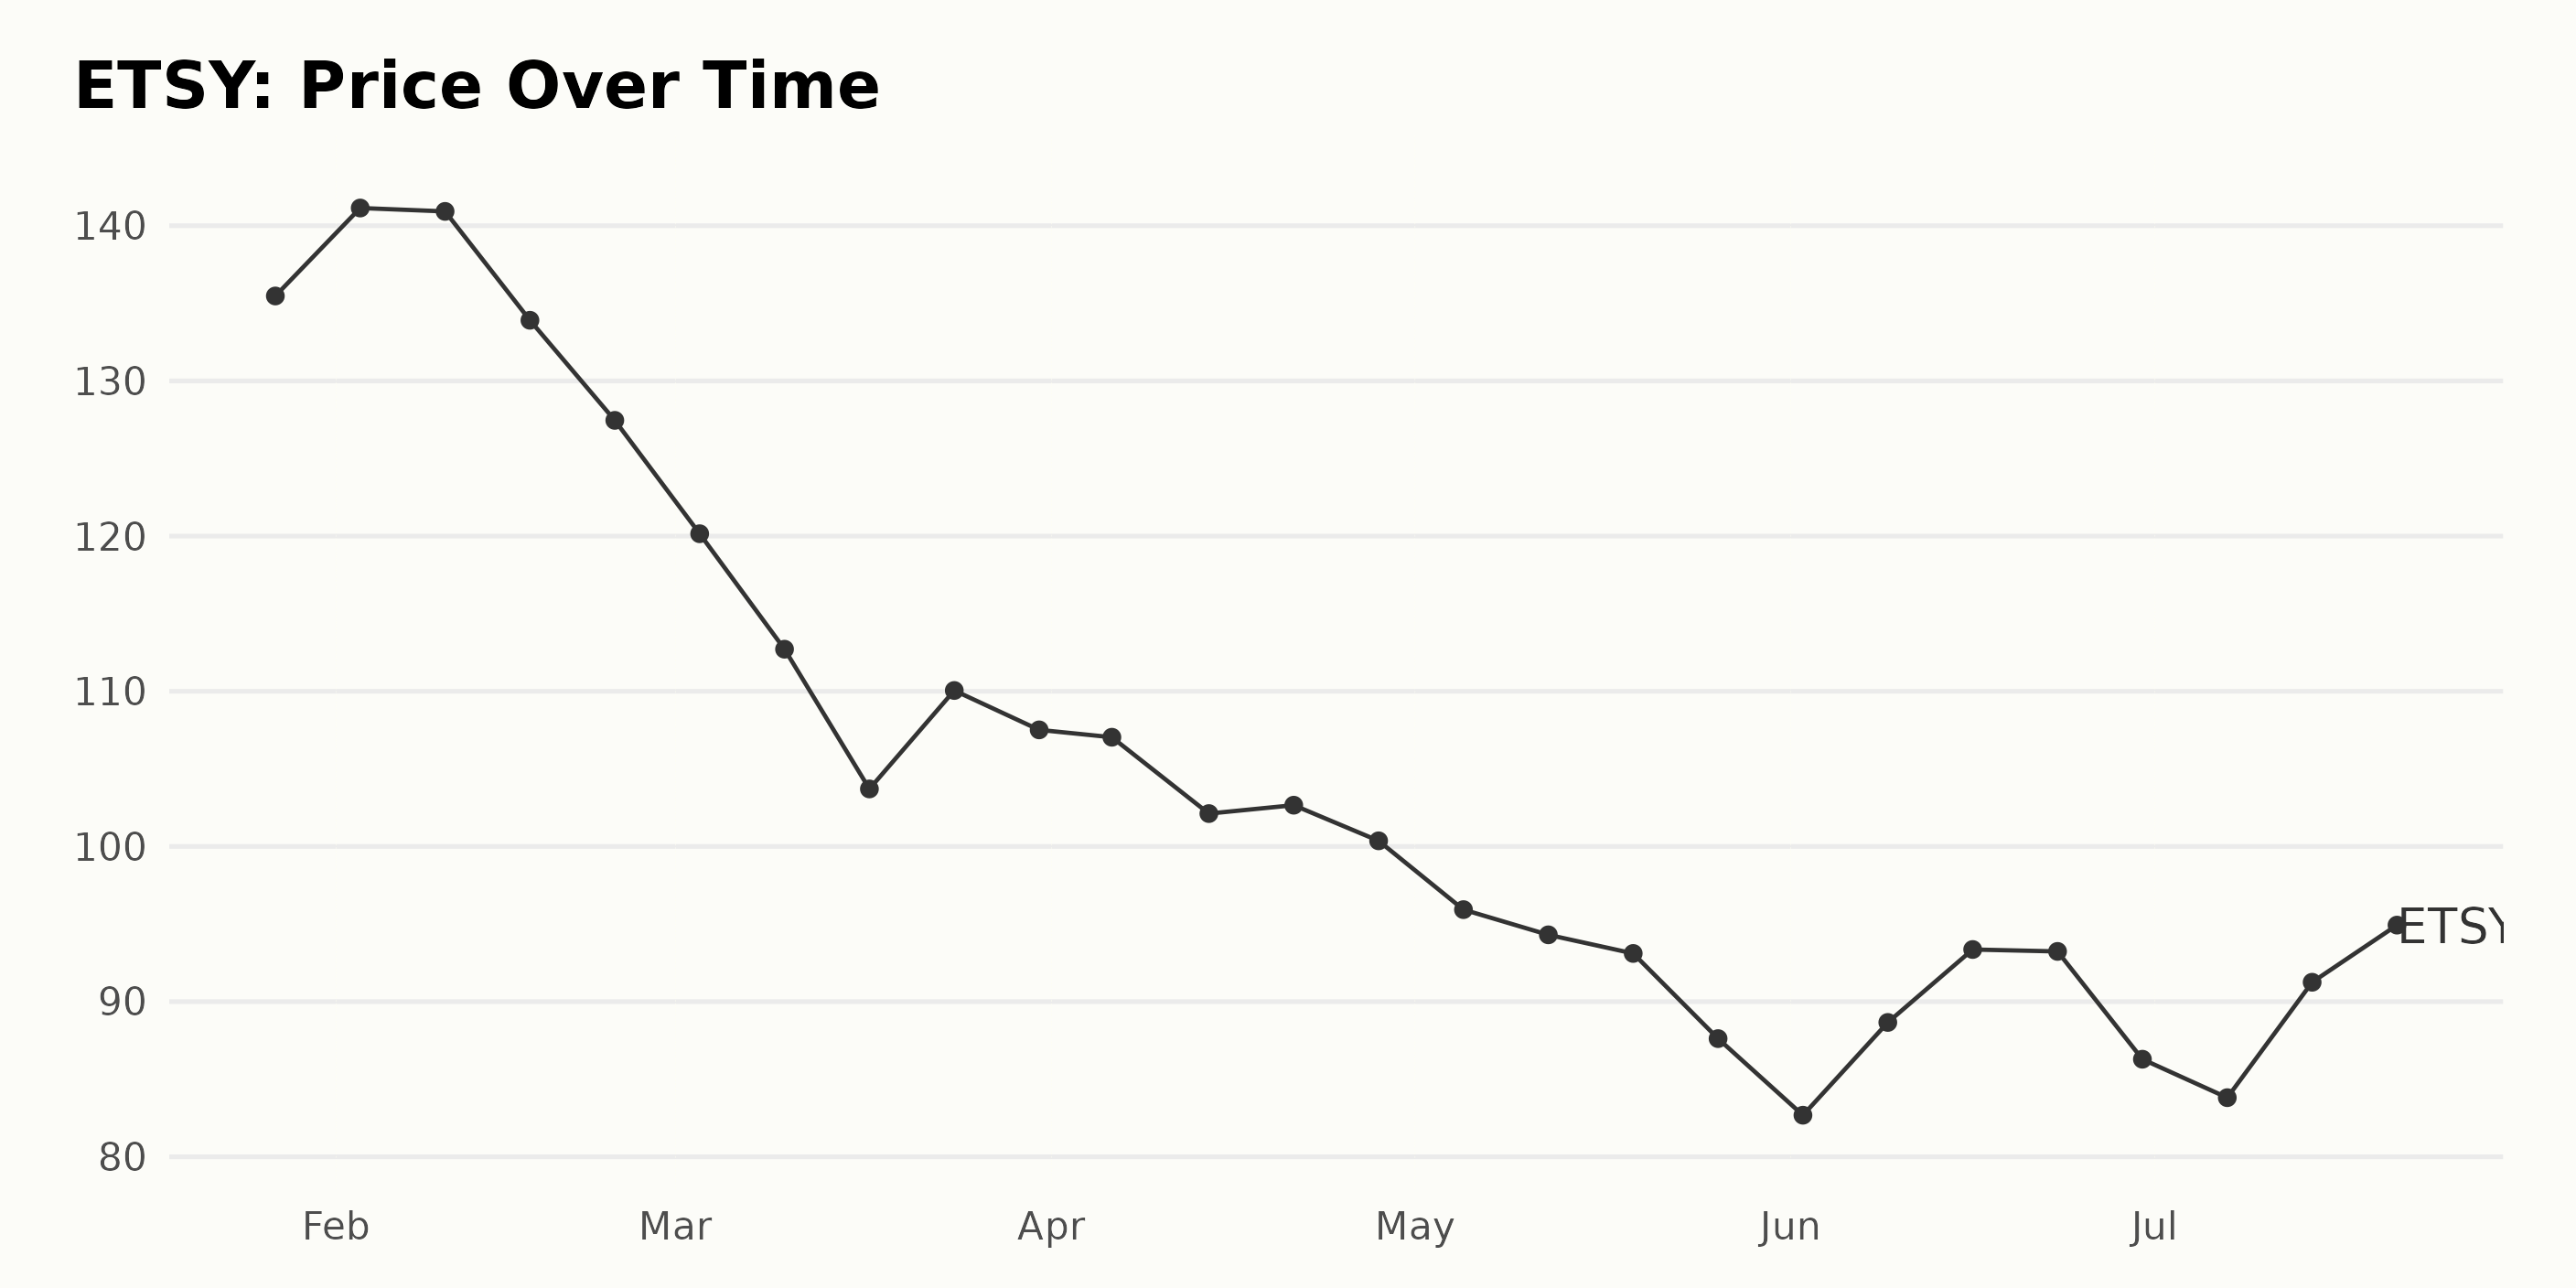
ETSY Share Price: Exploring the Downward Trend from January to July 2023
ETSY share price data from January to July 2023 shows a generally decreasing trend with minor fluctuations. Here's a breakdown with more detail:
- In January 2023, the share price started at $135.47.
- The price exhibited an increase and peaked at $141.14 on February 3 before starting to decrease again.
- It experienced noticeable declines throughout late February and March, dipping as low as $103.71 on March 17 but slightly increased to the end of March at $107.51.
- In April, the share price showed moderate fluctuation but generally maintained around $102.00, with the month ending at $100.36.
- The decreasing pattern accelerated in May, showing a steady decrease and closing the month at $87.62.
- June saw mixed trends: a rise to $93.36 mid-month but ended lower than it started, at $86.29.
- As of July 21, the last data point provided, the share price has risen to $96.74, which is still significantly less than the January start price.
In terms of growth rate, the overall trend signifies a negative growth rate for this duration. It is important to note variations and anomalies within this overall trend, including growth points in early February, late March, mid-June, and mid-July. However, the overarching trend appears to be decelerating. Here is a chart of ETSY's price over the past 180 days.
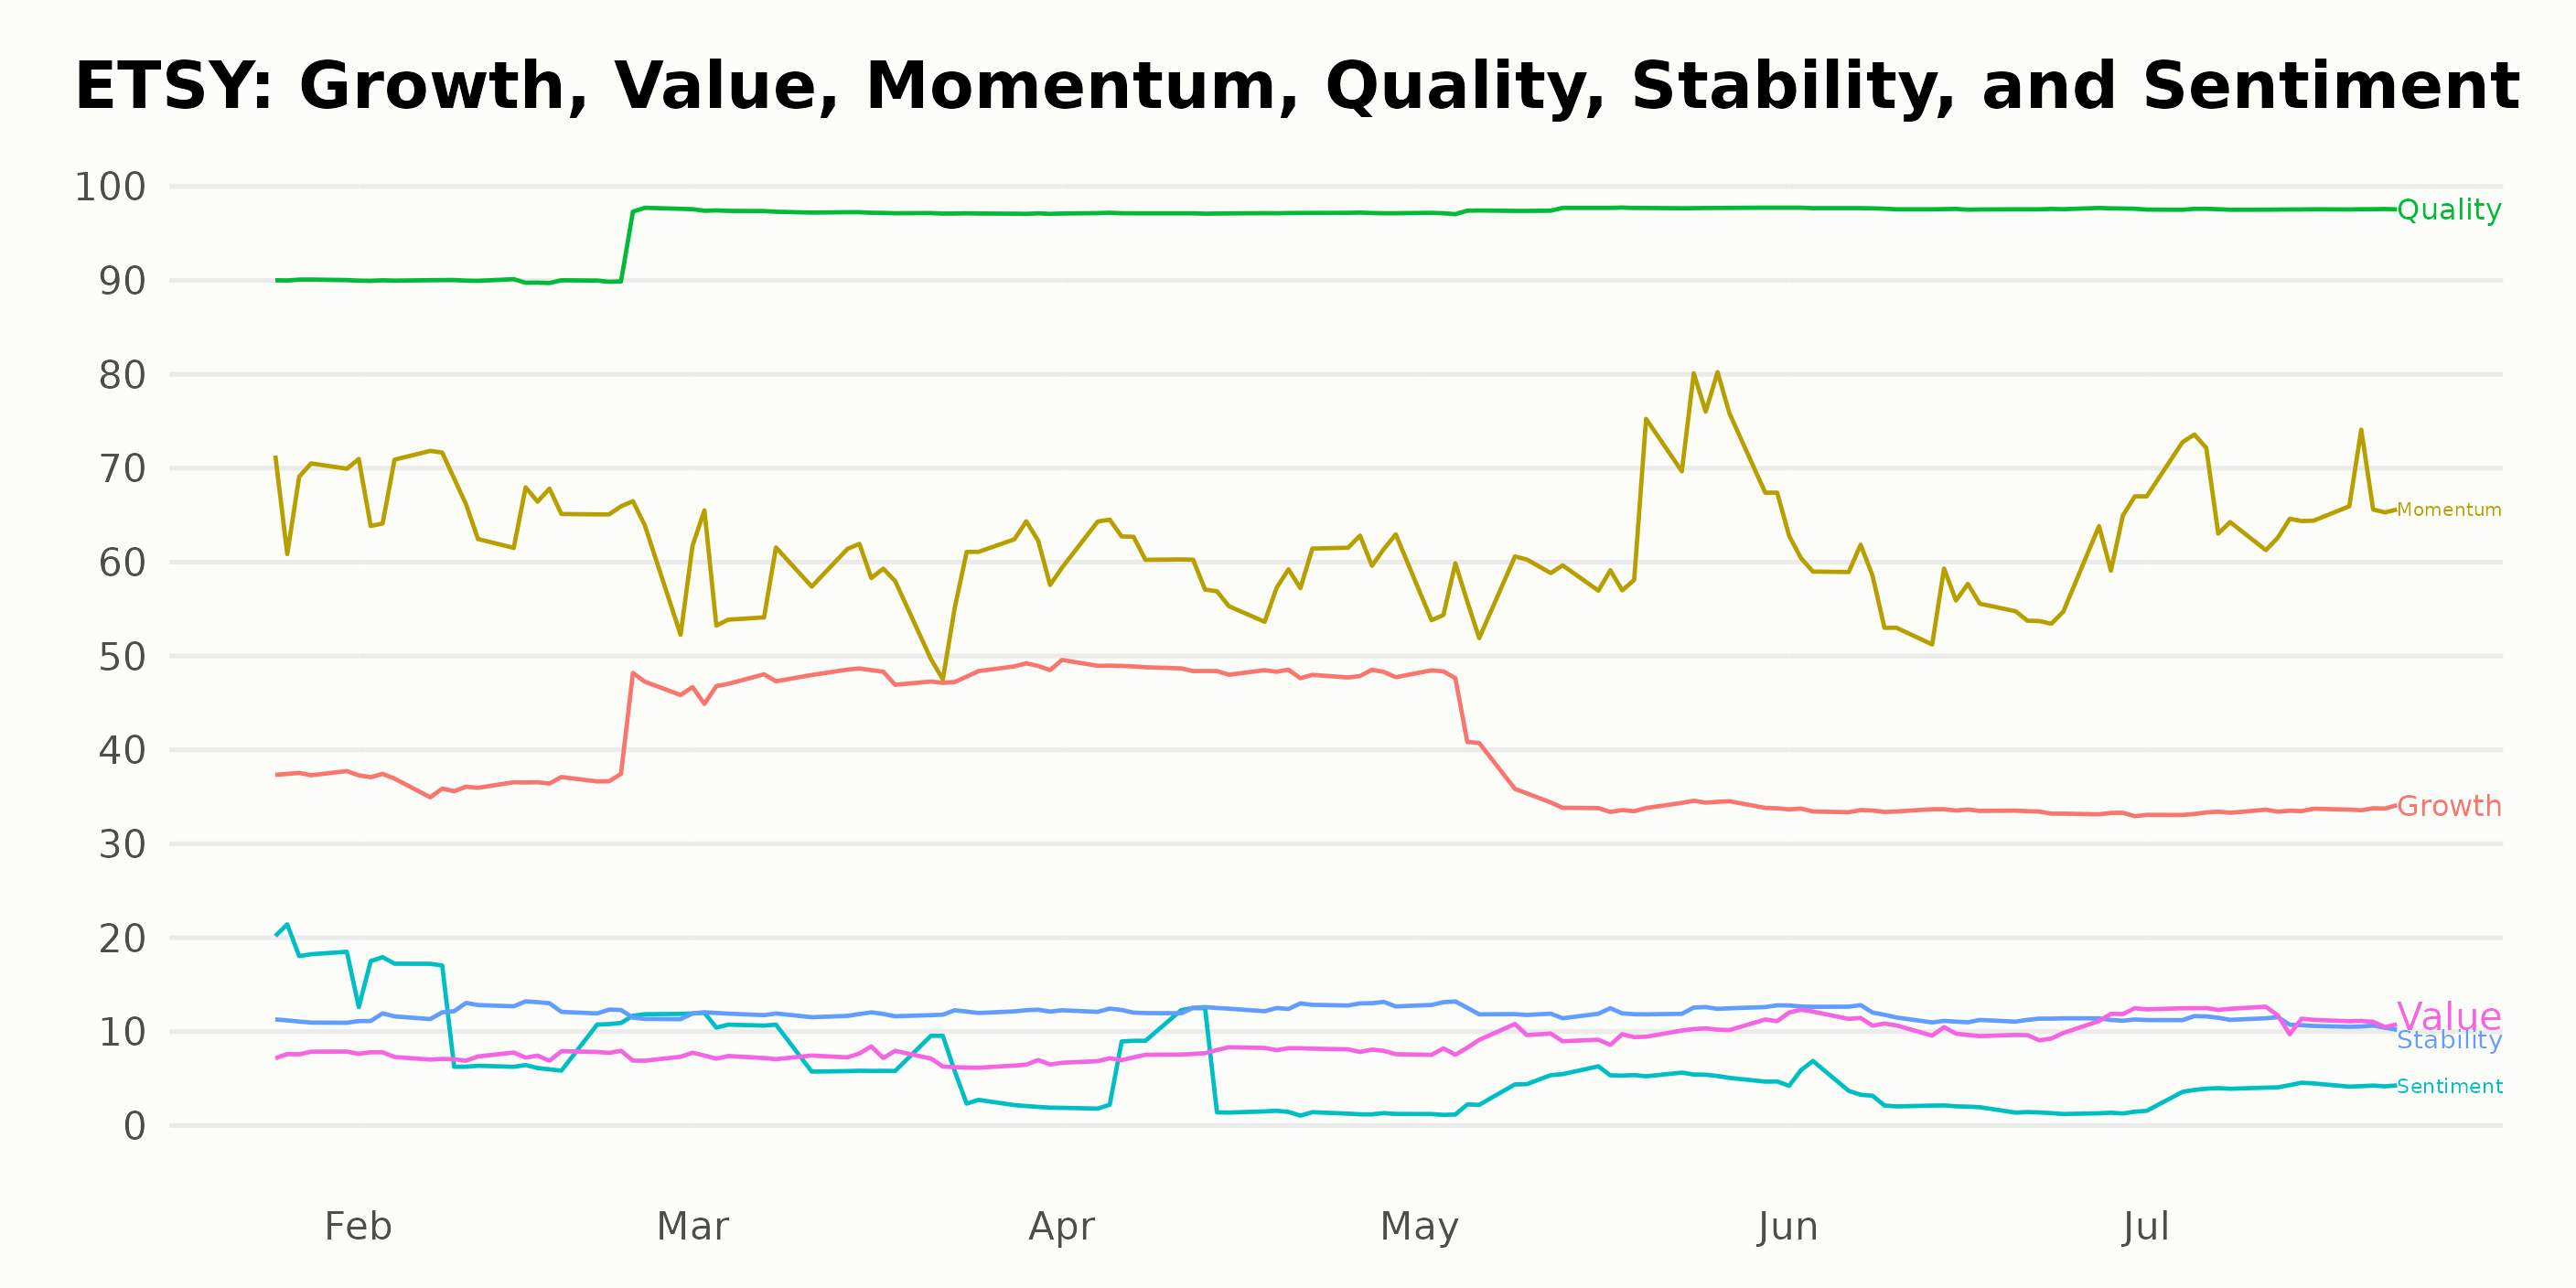
Assessing Etsy's Performance: A Detailed Analysis of Quality, Growth, and Momentum
As of July 24, 2023, ETSY, a company in the Internet category of stocks, has a POWR Ratings grade of C (Neutral). Analyzing the year-to-date data, there have been fluctuations in its rank within the category, which comprises a total of 58 stocks.
Although there have been minor improvements at times, there is a general trend of increasing rank, which is a concerning sign. The rank peaked on June 24, 2023, when the POWR grade slipped to D (Sell), indicating the company's relatively weaker performance amongst its peers. Here are some key points about ETSY's ranking evolution:
- It began the examined period in late January 2023 with a rank of #37 before slipping to #38 by early February.
- After that, it stayed mostly between the rank #38-39 until the end of March.
- In April, it saw a slight worsening in rank to #41 but managed to improve back to #38 by the end of the month.
- May witnessed no major changes, with the rank swaying between #38 and #40.
- In June, ETSY rank dropped further, ranging between #43-44, and saw its POWR grade slip to D (Sell) briefly.
- As of July 22, 2023, the company has improved its rank slightly to #42 while maintaining its C (Neutral) grade.
To conclude, ETSY's fluctuating rank over the months indicates an inconsistent performance relative to other internet stocks. Its latest POWR grade denotes average performance. This varied ranking highlights the need for further evaluation and close monitoring of the company’s operational and financial metrics going forward.
After analyzing the POWR Ratings for ETSY, it's evident that the three most noteworthy dimensions are Quality, Growth, and Momentum. Here's how these dimensions have performed:
- Quality: This consistently achieved high ratings. In January 2023, the quality rating was 90, and it significantly increased over the months, reaching 98 by May, a level it maintained until July 2023. This indicates ETSY’s ability to consistently deliver quality performance relative to other stocks in its sector.
- Growth: The growth dimension experienced varied ratings - a score as high as 48 in March 2023 and April 2023 and as low as 33 in June 2023. This suggests fluctuating growth rates over this period.
- Momentum: The momentum ratings also fluctuated but maintained scores above 58 from January through July 2023. However, there was a noticeable dip in March (58), which later saw an upward trend, peaking at 67 in July 2023. This shows that the stock has had variable price momentum during this period.
These trends and high ratings suggest a strong overall performance by ETSY according to the POWR Ratings system. However, the fluctuations in growth and momentum ratings indicate a need to monitor these dimensions regularly.
How does Etsy, Inc. (ETSY) Stack Up Against its Peers?
Other stocks in the Internet sector that may be worth considering are trivago N.V. (TRVG), Yelp Inc. (YELP), and Travelzoo (TZOO) - they have better POWR Ratings.
What To Do Next?
Get your hands on this special report with 3 low priced companies with tremendous upside potential even in today’s volatile markets:
3 Stocks to DOUBLE This Year >
ETSY shares were trading at $97.44 per share on Monday afternoon, up $0.70 (+0.72%). Year-to-date, ETSY has declined -18.65%, versus a 19.81% rise in the benchmark S&P 500 index during the same period.
About the Author: Anushka Dutta

Anushka is an analyst whose interest in understanding the impact of broader economic changes on financial markets motivated her to pursue a career in investment research.
The post Is Etsy, Inc. (ETSY) a Quality Stock to Buy? appeared first on StockNews.com