
Home appliances manufacturer Whirlpool (NYSE: WHR) missed Wall Street’s revenue expectations in Q4 CY2025, with sales flat year on year at $4.10 billion. The company’s full-year revenue guidance of $15.45 billion at the midpoint came in 0.9% below analysts’ estimates. Its GAAP profit of $1.91 per share was 32% above analysts’ consensus estimates.
Is now the time to buy Whirlpool? Find out by accessing our full research report, it’s free.
Whirlpool (WHR) Q4 CY2025 Highlights:
- Revenue: $4.10 billion vs analyst estimates of $4.26 billion (flat year on year, 3.7% miss)
- EPS (GAAP): $1.91 vs analyst estimates of $1.45 (32% beat)
- Adjusted EBITDA: $335 million vs analyst estimates of $269.3 million (8.2% margin, 24.4% beat)
- EPS (GAAP) guidance for the upcoming financial year 2026 is $6.25 at the midpoint, missing analyst estimates by 9.5%
- Operating Margin: 5.9%, up from -3.3% in the same quarter last year
- Free Cash Flow Margin: 24.1%, similar to the same quarter last year
- Market Capitalization: $4.69 billion
"With a challenging 2025 behind us, our confidence for 2026 is based on our recent successful product launches, reduced promotional intensity and a gradual recovery of the housing market."
Company Overview
Credited with introducing the first automatic washing machine, Whirlpool (NYSE: WHR) is a manufacturer of a variety of home appliances.
Revenue Growth
Examining a company’s long-term performance can provide clues about its quality. Any business can experience short-term success, but top-performing ones enjoy sustained growth for years. Whirlpool’s demand was weak over the last five years as its sales fell at a 4.4% annual rate. This was below our standards and suggests it’s a low quality business.
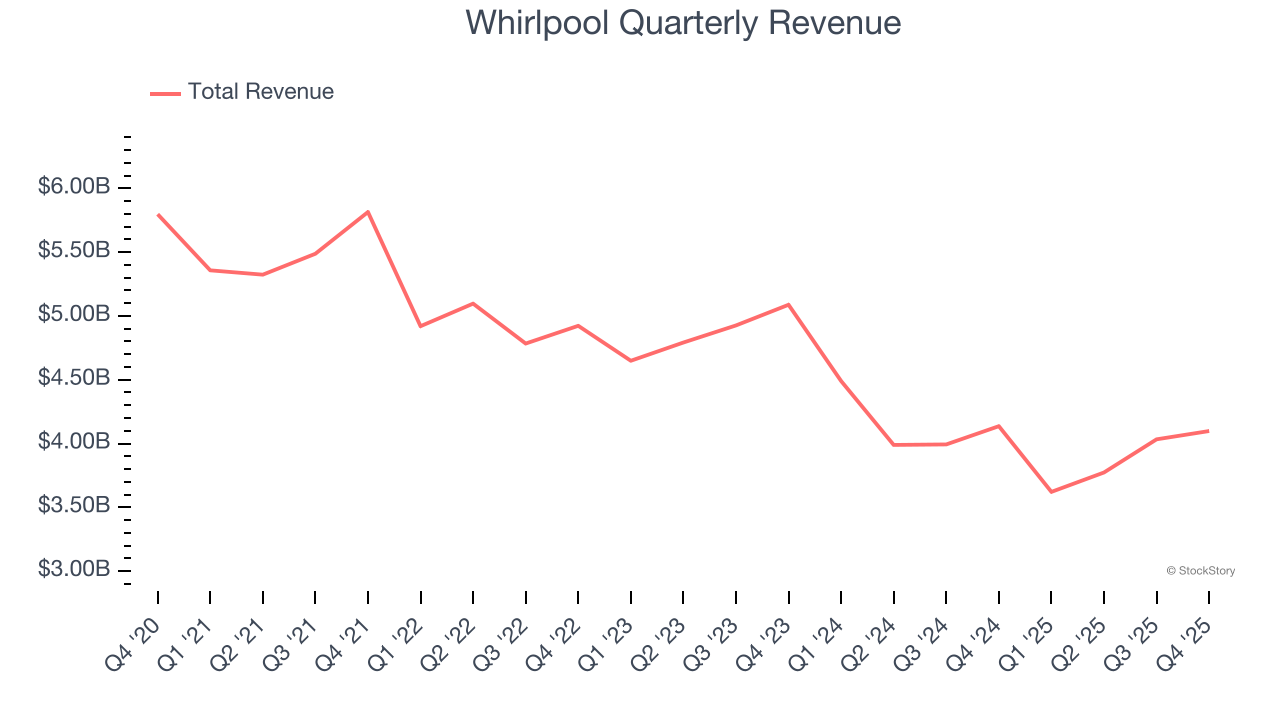
Long-term growth is the most important, but within industrials, a half-decade historical view may miss new industry trends or demand cycles. Whirlpool’s recent performance shows its demand remained suppressed as its revenue has declined by 10.7% annually over the last two years. 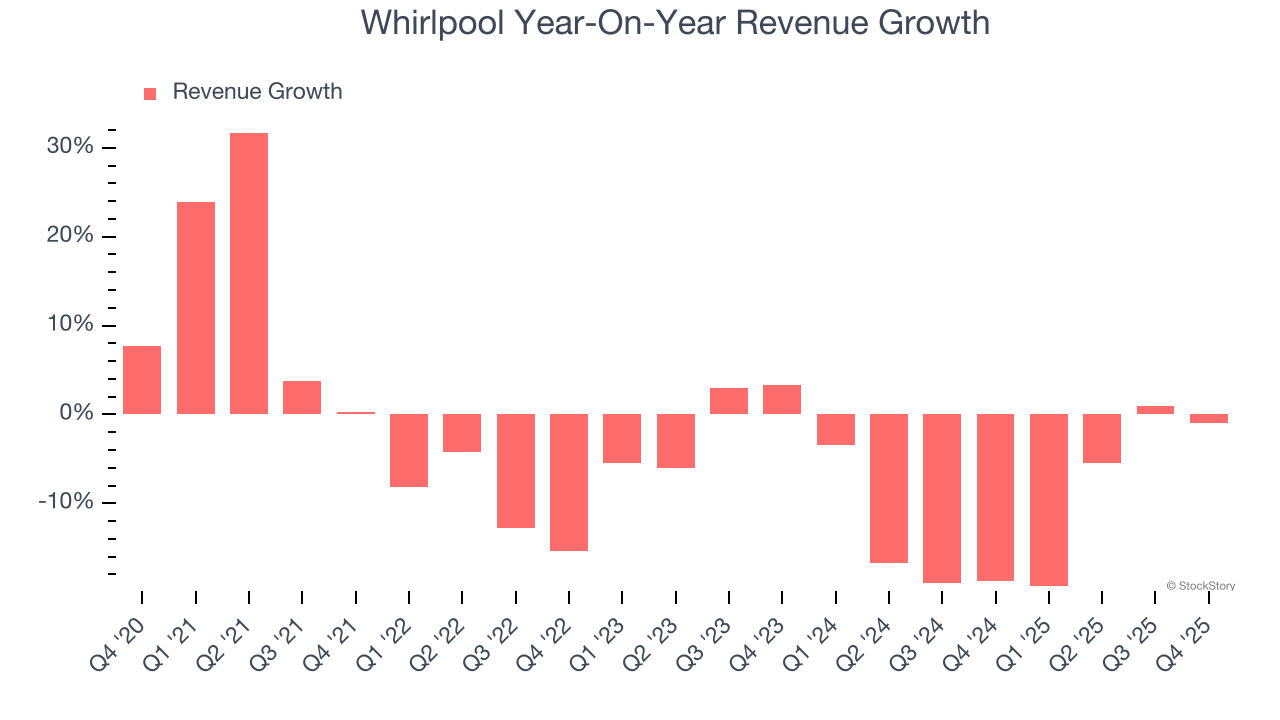
This quarter, Whirlpool missed Wall Street’s estimates and reported a rather uninspiring 0.9% year-on-year revenue decline, generating $4.10 billion of revenue.
Looking ahead, sell-side analysts expect revenue to remain flat over the next 12 months. While this projection suggests its newer products and services will fuel better top-line performance, it is still below average for the sector.
While Wall Street chases Nvidia at all-time highs, an under-the-radar semiconductor supplier is dominating a critical AI component these giants can’t build without. Click here to access our free report one of our favorites growth stories.
Operating Margin
Whirlpool was profitable over the last five years but held back by its large cost base. Its average operating margin of 3.5% was weak for an industrials business. This result isn’t too surprising given its low gross margin as a starting point.
Analyzing the trend in its profitability, Whirlpool’s operating margin decreased by 5.3 percentage points over the last five years. Whirlpool’s performance was poor no matter how you look at it - it shows that costs were rising and it couldn’t pass them onto its customers.
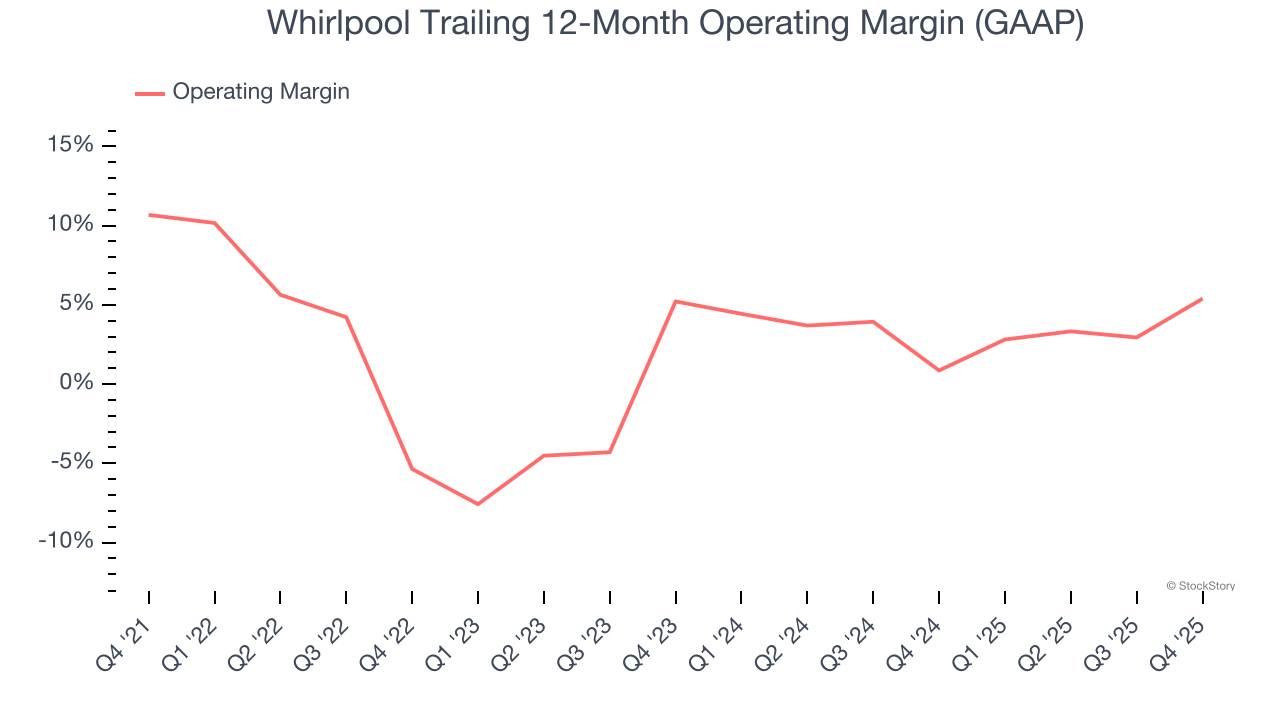
In Q4, Whirlpool generated an operating margin profit margin of 5.9%, up 9.2 percentage points year on year. The increase was solid, and because its gross margin actually decreased, we can assume it was more efficient because its operating expenses like marketing, R&D, and administrative overhead grew slower than its revenue.
Earnings Per Share
Revenue trends explain a company’s historical growth, but the long-term change in earnings per share (EPS) points to the profitability of that growth – for example, a company could inflate its sales through excessive spending on advertising and promotions.
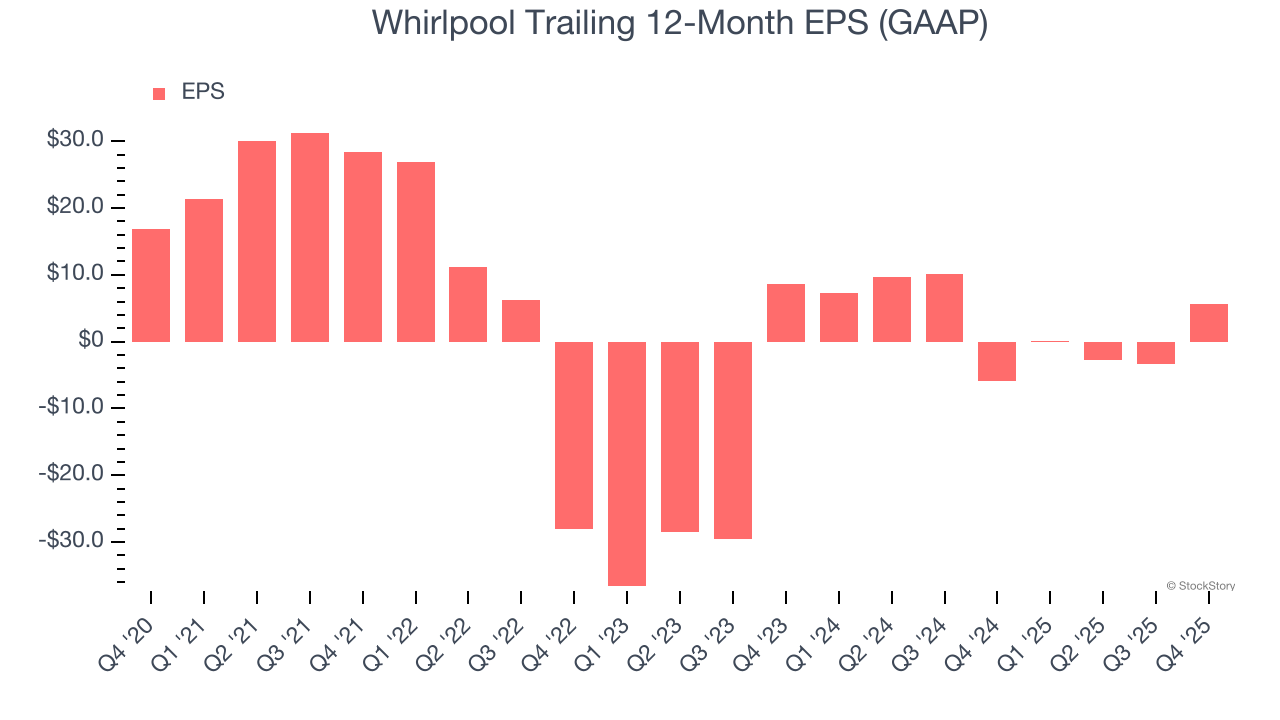
Sadly for Whirlpool, its EPS declined by 19.7% annually over the last five years, more than its revenue. This tells us the company struggled because its fixed cost base made it difficult to adjust to shrinking demand.
We can take a deeper look into Whirlpool’s earnings to better understand the drivers of its performance. As we mentioned earlier, Whirlpool’s operating margin expanded this quarter but declined by 5.3 percentage points over the last five years. This was the most relevant factor (aside from the revenue impact) behind its lower earnings; interest expenses and taxes can also affect EPS but don’t tell us as much about a company’s fundamentals.
Like with revenue, we analyze EPS over a more recent period because it can provide insight into an emerging theme or development for the business.
For Whirlpool, its two-year annual EPS declines of 19.4% are similar to its five-year trend. These results were bad no matter how you slice the data.
In Q4, Whirlpool reported EPS of $1.91, up from negative $7.09 in the same quarter last year. This print easily cleared analysts’ estimates, and shareholders should be content with the results. Over the next 12 months, Wall Street expects Whirlpool’s full-year EPS of $5.63 to grow 20.4%.
Key Takeaways from Whirlpool’s Q4 Results
It was good to see Whirlpool beat analysts’ EPS expectations this quarter. We were also excited its EBITDA outperformed Wall Street’s estimates by a wide margin. On the other hand, its full-year EPS guidance missed and its revenue fell short of Wall Street’s estimates. Overall, this was a weaker quarter. The stock traded down 6.4% to $75.63 immediately after reporting.
Big picture, is Whirlpool a buy here and now? When making that decision, it’s important to consider its valuation, business qualities, as well as what has happened in the latest quarter. We cover that in our actionable full research report which you can read here (it’s free).


