
Industrial supplier Fastenal (NASDAQ: FAST) met Wall Street’s revenue expectations in Q1 CY2025, with sales up 3.4% year on year to $1.96 billion. Its GAAP profit of $0.52 per share was in line with analysts’ consensus estimates.
Is now the time to buy Fastenal? Find out by accessing our full research report, it’s free.
Fastenal (FAST) Q1 CY2025 Highlights:
- Revenue: $1.96 billion vs analyst estimates of $1.96 billion (3.4% year-on-year growth, in line)
- EPS (GAAP): $0.52 vs analyst estimates of $0.52 (in line)
- Adjusted EBITDA: $437.9 million vs analyst estimates of $438.4 million (22.3% margin, in line)
- Operating Margin: 20.1%, in line with the same quarter last year
- Free Cash Flow Margin: 10.5%, down from 15% in the same quarter last year
- Sales Volumes rose 12.4% year on year (10.5% in the same quarter last year)
- Market Capitalization: $43.46 billion
Company Overview
Founded in 1967, Fastenal (NASDAQ: FAST) provides industrial and construction supplies, including fasteners, tools, safety products, and many other product categories to businesses globally.
Maintenance and Repair Distributors
Supply chain and inventory management are themes that grew in focus after COVID wreaked havoc on the global movement of raw materials and components. Maintenance and repair distributors that boast reliable selection and quickly deliver products to customers can benefit from this theme. While e-commerce hasn’t disrupted industrial distribution as much as consumer retail, it is still a real threat, forcing investment in omnichannel capabilities to serve customers everywhere. Additionally, maintenance and repair distributors are at the whim of economic cycles that impact the capital spending and construction projects that can juice demand.
Sales Growth
A company’s long-term performance is an indicator of its overall quality. Even a bad business can shine for one or two quarters, but a top-tier one grows for years. Regrettably, Fastenal’s sales grew at a mediocre 7.1% compounded annual growth rate over the last five years. This fell short of our benchmark for the industrials sector and is a rough starting point for our analysis.
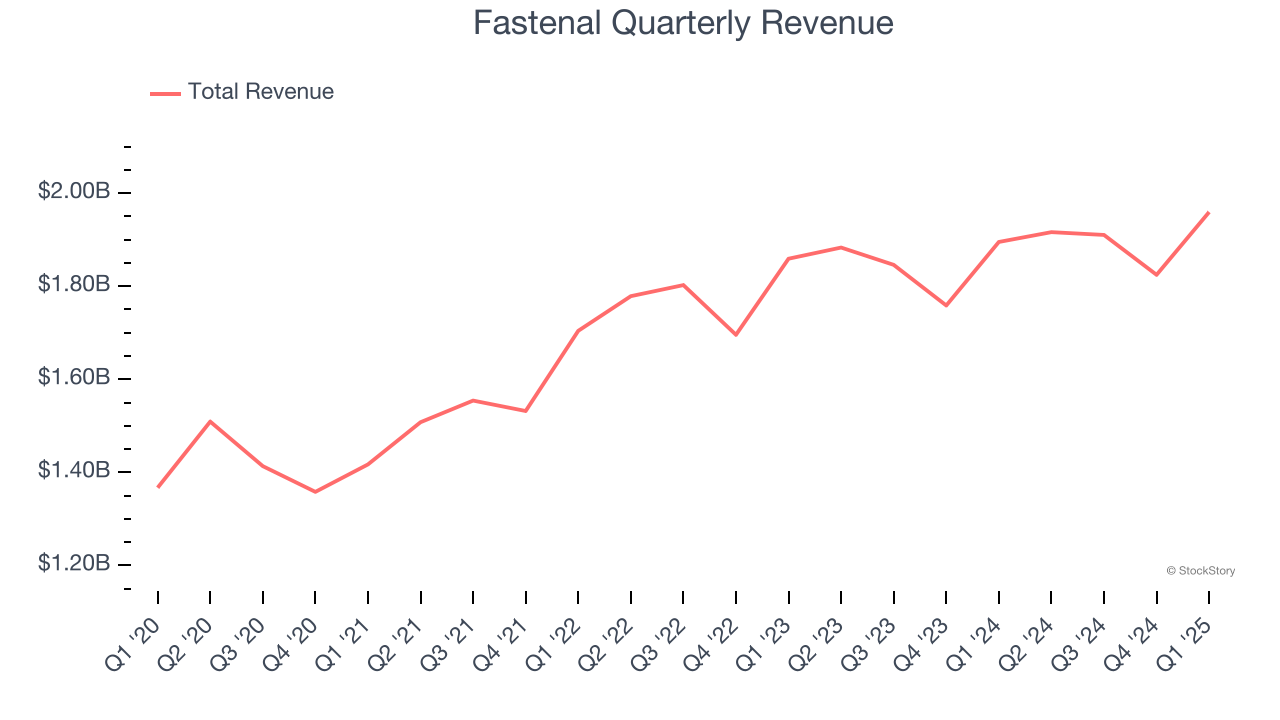
We at StockStory place the most emphasis on long-term growth, but within industrials, a half-decade historical view may miss cycles, industry trends, or a company capitalizing on catalysts such as a new contract win or a successful product line. Fastenal’s recent performance shows its demand has slowed as its annualized revenue growth of 3.3% over the last two years was below its five-year trend. We also note many other Maintenance and Repair Distributors businesses have faced declining sales because of cyclical headwinds. While Fastenal grew slower than we’d like, it did do better than its peers. 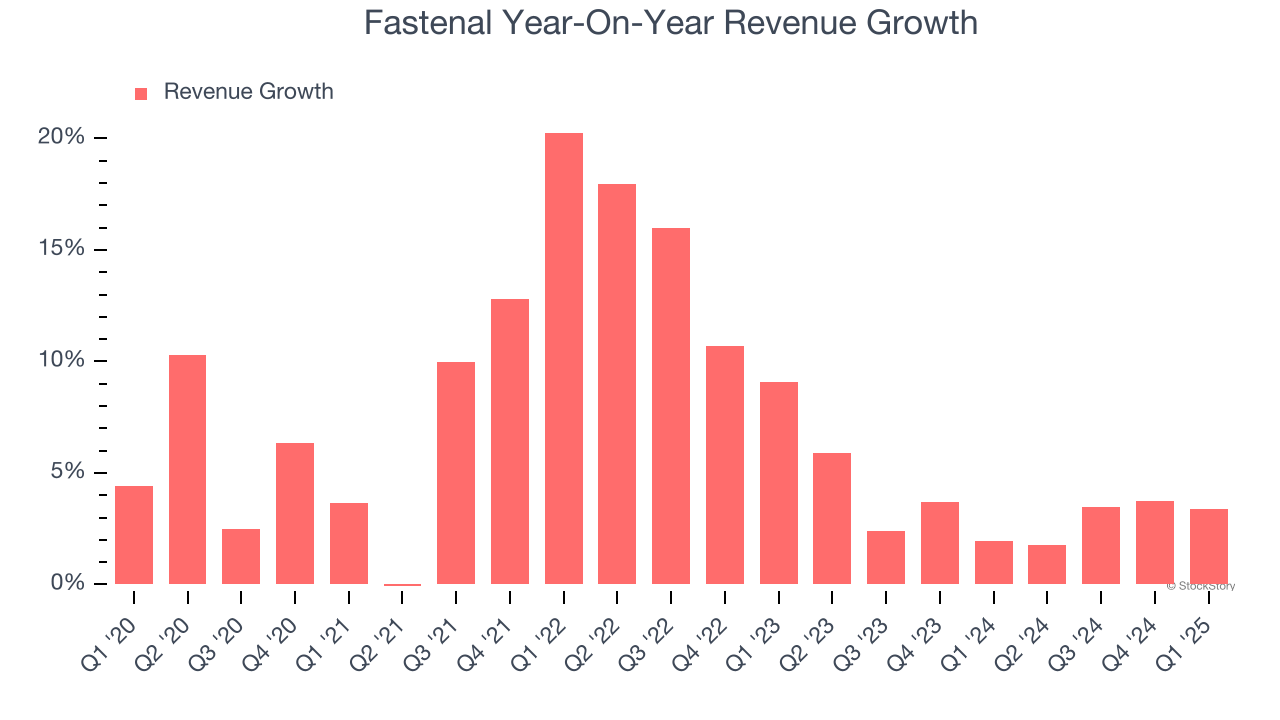
We can better understand the company’s revenue dynamics by analyzing its number of units sold, which reached 129,996 in the latest quarter. Over the last two years, Fastenal’s units sold averaged 11.3% year-on-year growth. Because this number is better than its revenue growth, we can see the company’s average selling price decreased. 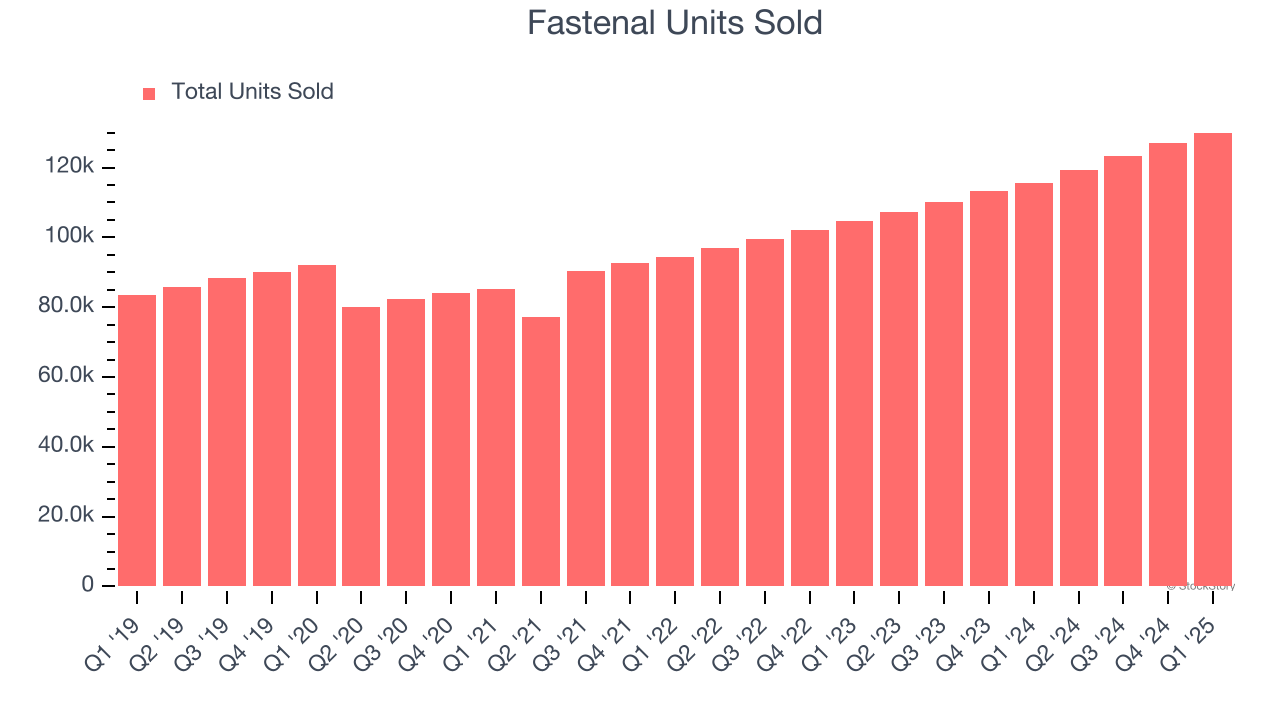
This quarter, Fastenal grew its revenue by 3.4% year on year, and its $1.96 billion of revenue was in line with Wall Street’s estimates.
Looking ahead, sell-side analysts expect revenue to grow 7.7% over the next 12 months, an improvement versus the last two years. This projection is above average for the sector and indicates its newer products and services will catalyze better top-line performance.
Unless you’ve been living under a rock, it should be obvious by now that generative AI is going to have a huge impact on how large corporations do business. While Nvidia and AMD are trading close to all-time highs, we prefer a lesser-known (but still profitable) stock benefiting from the rise of AI. Click here to access our free report one of our favorites growth stories.
Operating Margin
Fastenal has been a well-oiled machine over the last five years. It demonstrated elite profitability for an industrials business, boasting an average operating margin of 20.4%. This result isn’t surprising as its high gross margin gives it a favorable starting point.
Analyzing the trend in its profitability, Fastenal’s operating margin might fluctuated slightly but has generally stayed the same over the last five years. This raises questions about the company’s expense base because its revenue growth should have given it leverage on its fixed costs, resulting in better economies of scale and profitability.
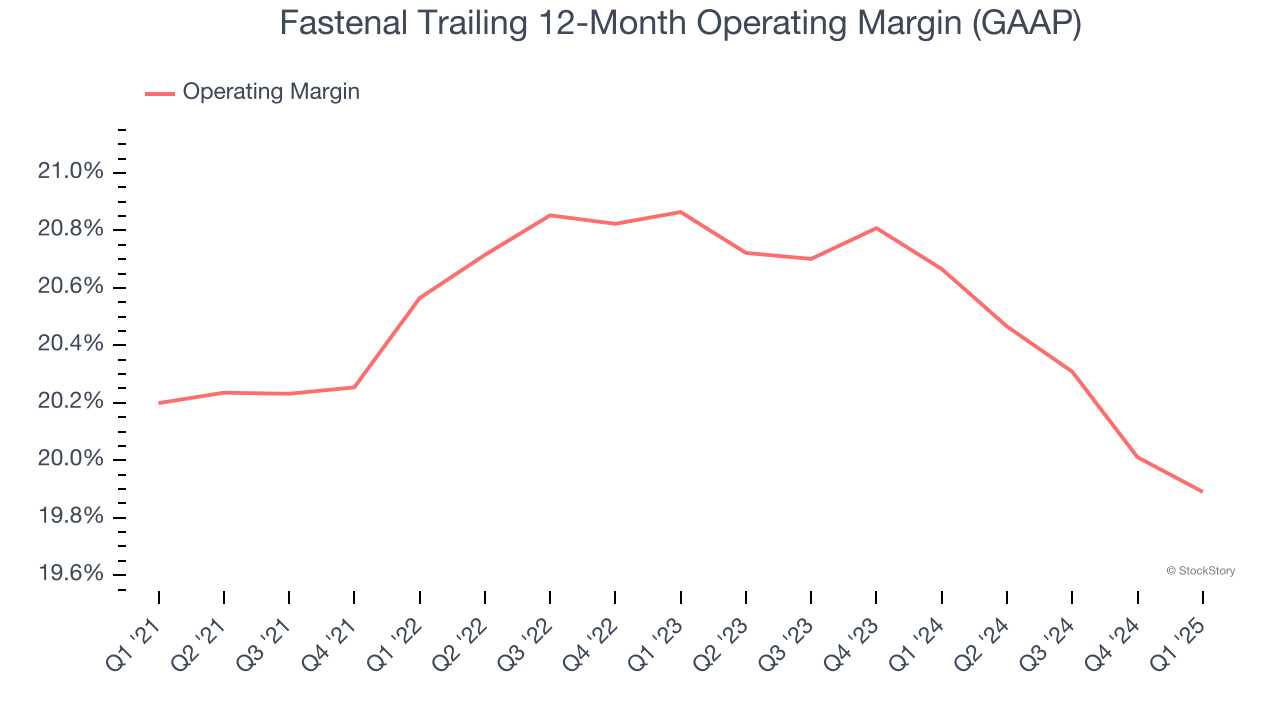
In Q1, Fastenal generated an operating profit margin of 20.1%, in line with the same quarter last year. This indicates the company’s cost structure has recently been stable.
Earnings Per Share
Revenue trends explain a company’s historical growth, but the long-term change in earnings per share (EPS) points to the profitability of that growth – for example, a company could inflate its sales through excessive spending on advertising and promotions.
Fastenal’s unimpressive 7.6% annual EPS growth over the last five years aligns with its revenue performance. This tells us it maintained its per-share profitability as it expanded.
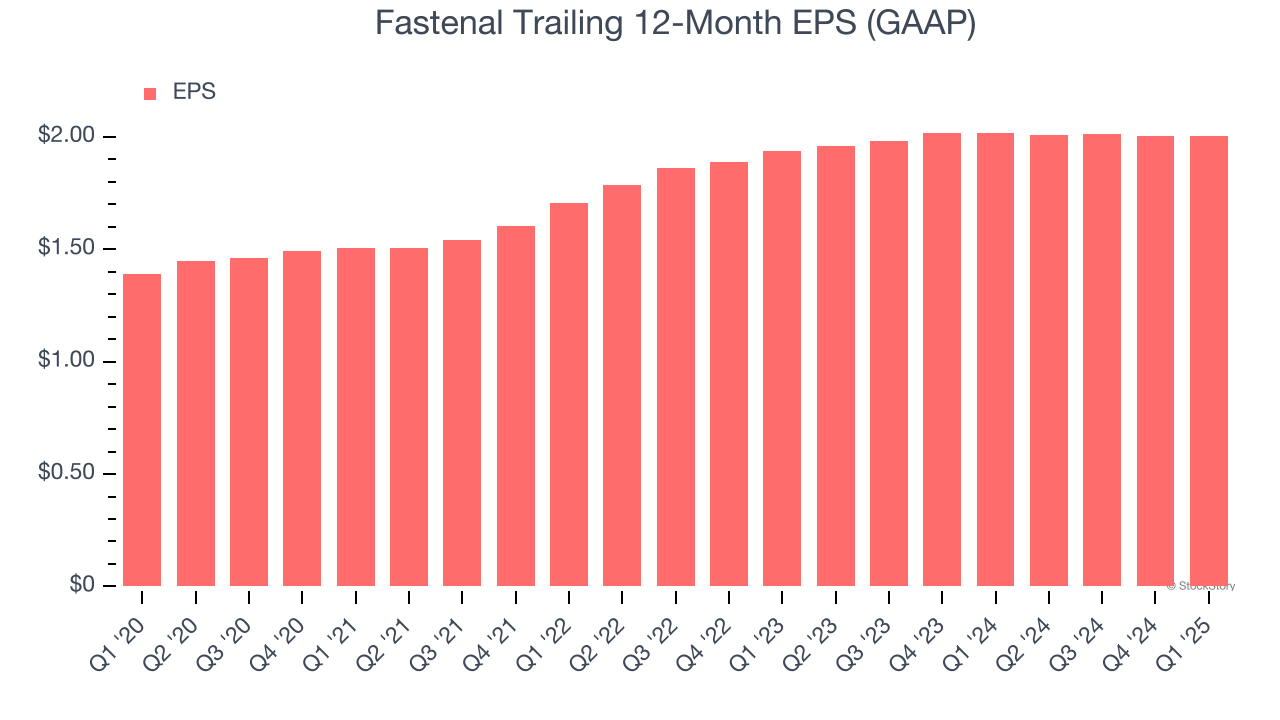
Like with revenue, we analyze EPS over a more recent period because it can provide insight into an emerging theme or development for the business.
Fastenal’s two-year annual EPS growth of 1.8% was subpar and lower than its 3.3% two-year revenue growth.
In Q1, Fastenal reported EPS at $0.52, in line with the same quarter last year. This print was close to analysts’ estimates. Over the next 12 months, Wall Street expects Fastenal’s full-year EPS of $2.01 to grow 9.6%.
Key Takeaways from Fastenal’s Q1 Results
We were impressed by how significantly Fastenal blew past analysts’ sales volume expectations this quarter. Overall, we think this was a decent quarter with some key metrics above expectations. The stock was flat after the report.
Should you buy the stock or not? What happened in the latest quarter matters, but not as much as longer-term business quality and valuation, when deciding whether to invest in this stock. We cover that in our actionable full research report which you can read here, it’s free.


