The latest economic headlines out of China talk of a record trade surplus, despite the ongoing trade war with the Untied States.
The phrase of the day seemed to be “Resource Nationalism”, offered as one reason for silver's meteoric rise at the end of 2025 and into early 2026.
Don’t Miss a Day: From crude oil to coffee, sign up free for Barchart’s best-in-class commodity analysis.USDA continues to estimate the US as the biggest global player in corn, raising the question/likelihood of the commodity falling under the classification of “National Resource”.
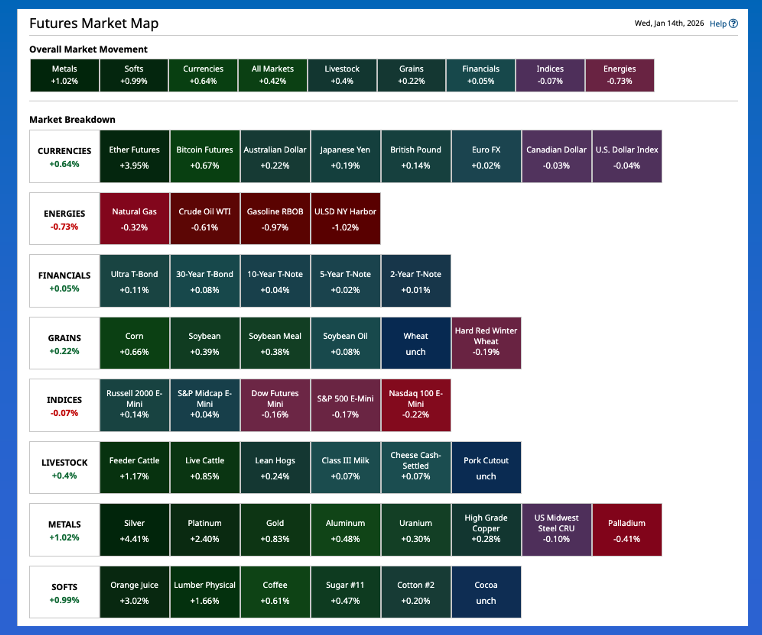
Morning Summary: The phrase of the day would seem to be “Resource Nationalism”. As I checked the pre-dawn news, this term was used a number of times as an answer to Tuesday’s question of if Metals are being driven higher by safe-haven buying only. One of the headlines on CNBC.com Wednesday morning was, “Resource nationalism could propel gold to $5,000 and silver to $100 this year”. What is “resource national”? I asked Al, as in Bundy, also known as AI (Artificial Intelligence), and the algorithm replied with, “when a government asserts greater control over its natural resources for economic, strategic, or political reasons”. Recall I talked about gold at 5K last fall, though silver took center stage late in the year. Overnight saw the March issue (SIH26) take out $90 on its way to an all-time high (so far) of $91.37, up $5.03 (5.8%). Within the CNBC story was the tidbit “China placed export controls on the metal in December”, part of why silver acted like a short-supply market last month. Then there was this headline, “China’s annual trade surplus hits a record $1.2 trillion” despite shipments to the US declining for a ninth straight month. My takeaway from this is China doesn’t need the US, putting the spotlight on the flip side of that coin.
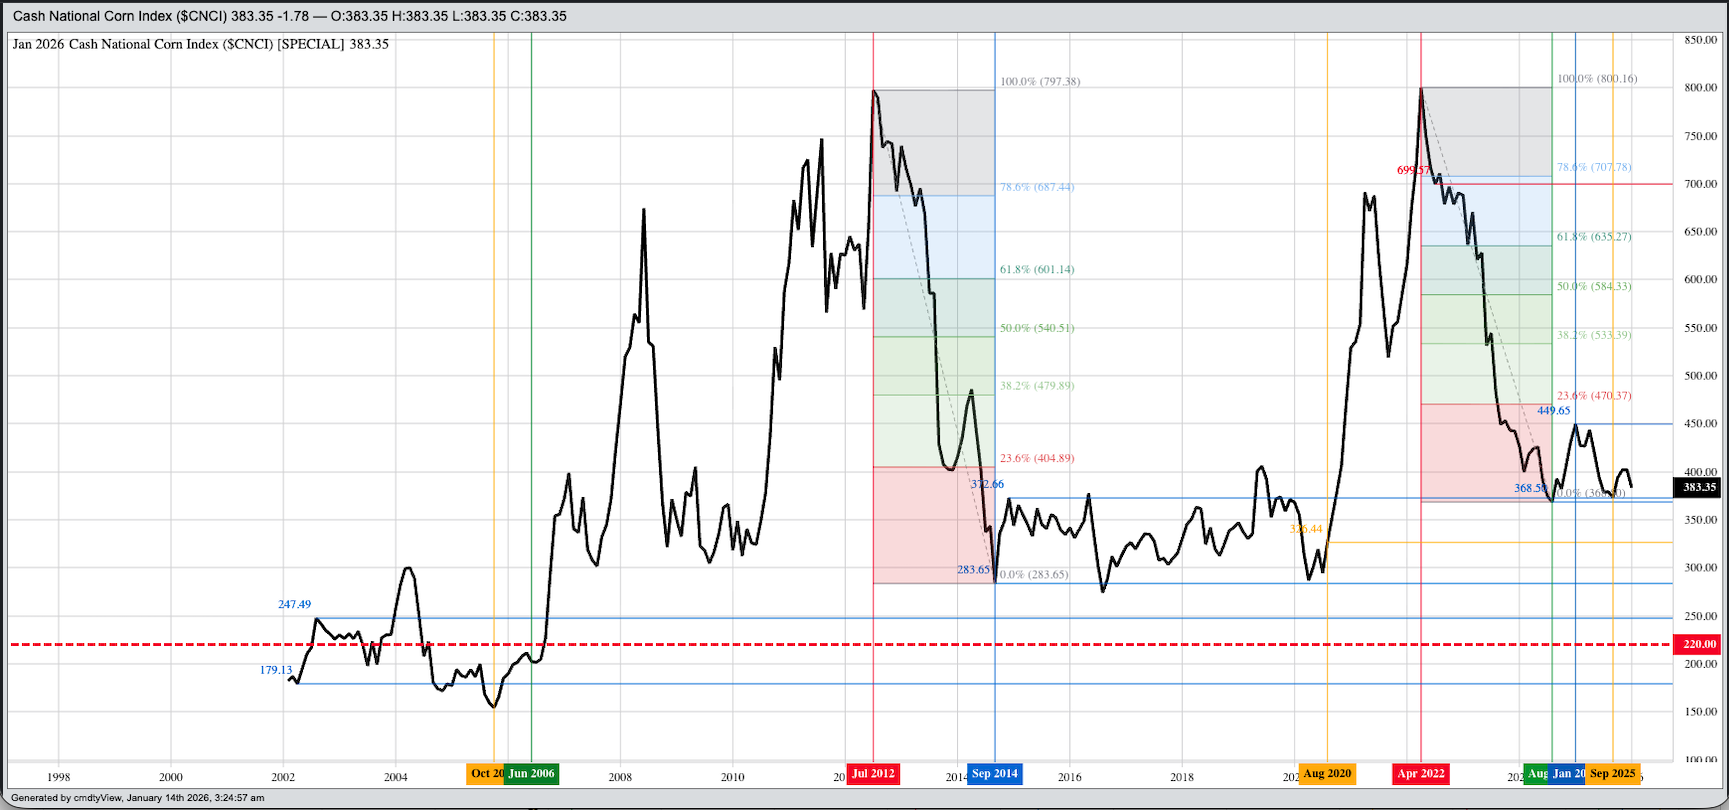
Corn: If “resource nationalism” is the hot topic of the moment, and the US continues to be the world leader in production, usage, and exports of corn, does that make the commodity a “natural resource” to be controlled by the government for “economic, strategic, or political reasons”? I was asked on RFD-TV Tuesday if the US corn market was headed toward government loan price and Loan Deficiency Payments (LDP) given the somewhat curious USDA numbers released Monday. Think about it this way: As I’ve said before, with US midterm elections coming around this fall; the current administration demanding lower prices of fuel, food, housing, etc.; USDA charged with doing its part to make this happen; and US corn possibly considered a national resource, the cash price – intrinsic value of the market – could be pulled below the government loan price to put more control over the commodity in the hands of that same government. For the record, the US government loan price for corn is $2.20 per bushel with the National Corn Index ($CNCI) coming in Tuesday night near $3.83. This put national average basis at 36.5 cents under March futures, as compared to the previous 5-year low weekly close for this week of 32.25 cents under March.
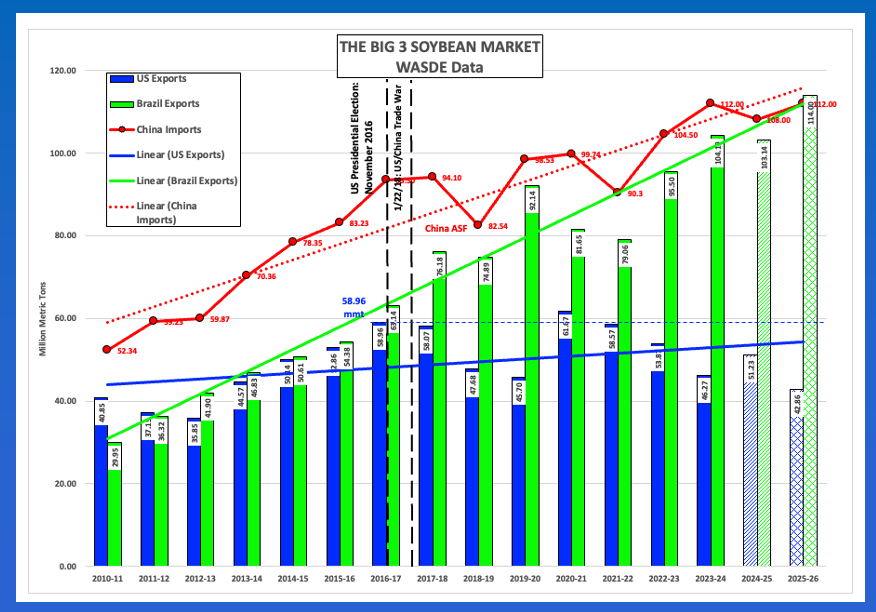
Soybeans: The soybean market should not be considered a US national resource, and therefore not a key part of economic, strategic, or political strategy. The ongoing trade war with China has made sure the US is no longer a key player in the global market with USDA’s latest guess on export demand of 42.9 million metric tons (mmt) for the 2025-26 marketing year. If realized, this would be the lowest US export figure since 2012-13’s 35.9 mmt. Meanwhile, USDA estimated Brazil’s exports to climb to a new record of 114.0 mmt. Again, if realized, this would mean the US would ship only 38% of Brazil’s exports. Reportedly, at the end of the 2014-2015 marketing year (August 2015), there was only a 1% difference between the world’s two largest exporters. Then came the US presidential election of 2016 and the social media created trade war in January 2018. We will get our next weekly export sales and shipments update, for the week ending Thursday, January 8, tomorrow morning with the spotlight on unshipped sales of US soybeans to China. As for the US market, the National Soybean Index ($CNSI) came in Tuesday night near $9.69, with the previous 5-year low end of January price near $9.78 from last year.
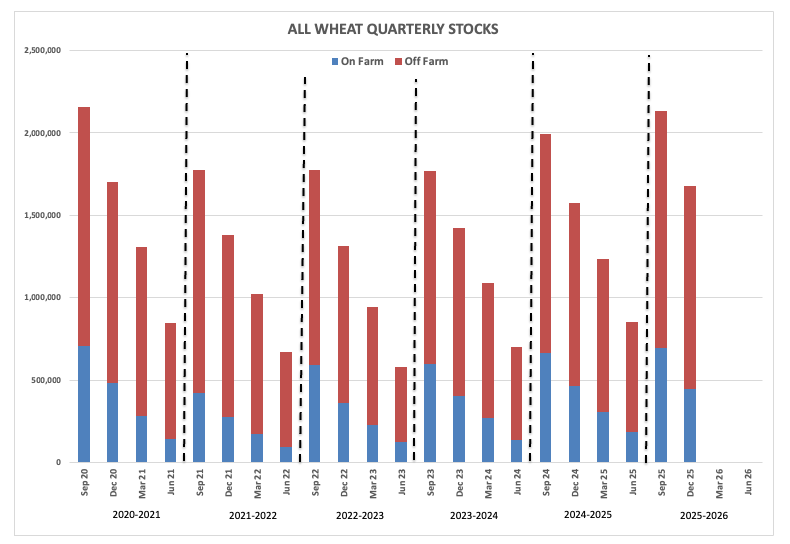
Wheat: And then there’s wheat, a commodity that belongs to the world. We know it can be grown almost anywhere, with one of my favorite reference points the fact Saudi Arabia once had a national program for growing the crop in the desert sand. For whatever reason, this program was scrapped in favor of pumping oil. Imagine that. All three markets of the sub-sector were under pressure overnight through early Wednesday morning with March HRW, the largest class grown in the US, sliding as much as 3.5 cents on trade volume of only 2,000 contracts. For now, the March issue continues to hold above its lifetime low of $5.1325, sitting at $5.2950 as of this writing. Fundamentally, the market remains bearish, but we knew that long before USDA released its latest quarterly stocks figure for all wheat of 1.675 bb, the largest December 1 stocks number since 2020’s 1.703 bb. Recall both the HRW ($CRWI) and SRW ($CSWI) National Cash Indexes were below previous 5-year low prices at the end of November, with the HRS ($CRSI) Index joining the party at the end of December. Based on the Law of Supply and Demand, low cash prices tell us supplies continue to outdistance demand by a sizeable amount.
On the date of publication, Darin Newsom did not have (either directly or indirectly) positions in any of the securities mentioned in this article. All information and data in this article is solely for informational purposes. For more information please view the Barchart Disclosure Policy here.
More news from Barchart