USDA/FAS released its weekly export sales and shipments numbers for the week ending Thursday, September 25 on the morning of Thursday, November 13.
The Grains sector acted as if it had not had an inkling of what supply and demand has been doing for the various markets during the past month and a half.
Don’t Miss a Day: From crude oil to coffee, sign up free for Barchart’s best-in-class commodity analysis.Things will get more interesting Friday when USDA releases its November round of WASDE imaginary numbers.
That sound we heard coming from the Grains sector Thursday morning was a great Huzzah! After two months of hand wringing, gnashing of teeth, and rending of garments the industry in general finally got the fix it needed: USDA/FAS released its “latest” weekly export sales and shipments numbers, this round for the week ending Thursday, September 25. Prior to the old envelope being unsealed, the dust blown off for good measure, the Grains sector moved into Thursday’s intermission in quiet fashion:
- December corn (ZCZ25) was at $4.3625, up 1.0 cent from Wednesday’s settlement
- The January soybean contract (ZSF26) was $11.4150, up 7.75 cents after trading both sides of unchanged overnight
- December SRW wheat (ZWZ25) was at $5.3425, down 1.75 cents from Wednesday’s close
Shortly after the releasee of the month and a half old numbers prior to the open of Thursday’s session:
- December corn gained as much as 4.25 cents
- The January soybean contract jumped to a high of $11.4875, up 15.0 cents for the day
- December SRW wheat erased its loss on its way to a high of $5.3875, up 2.75 cents from yesterday’s settlement
The dusty old numbers must’ve been extraordinary, right? Let’s take a look.
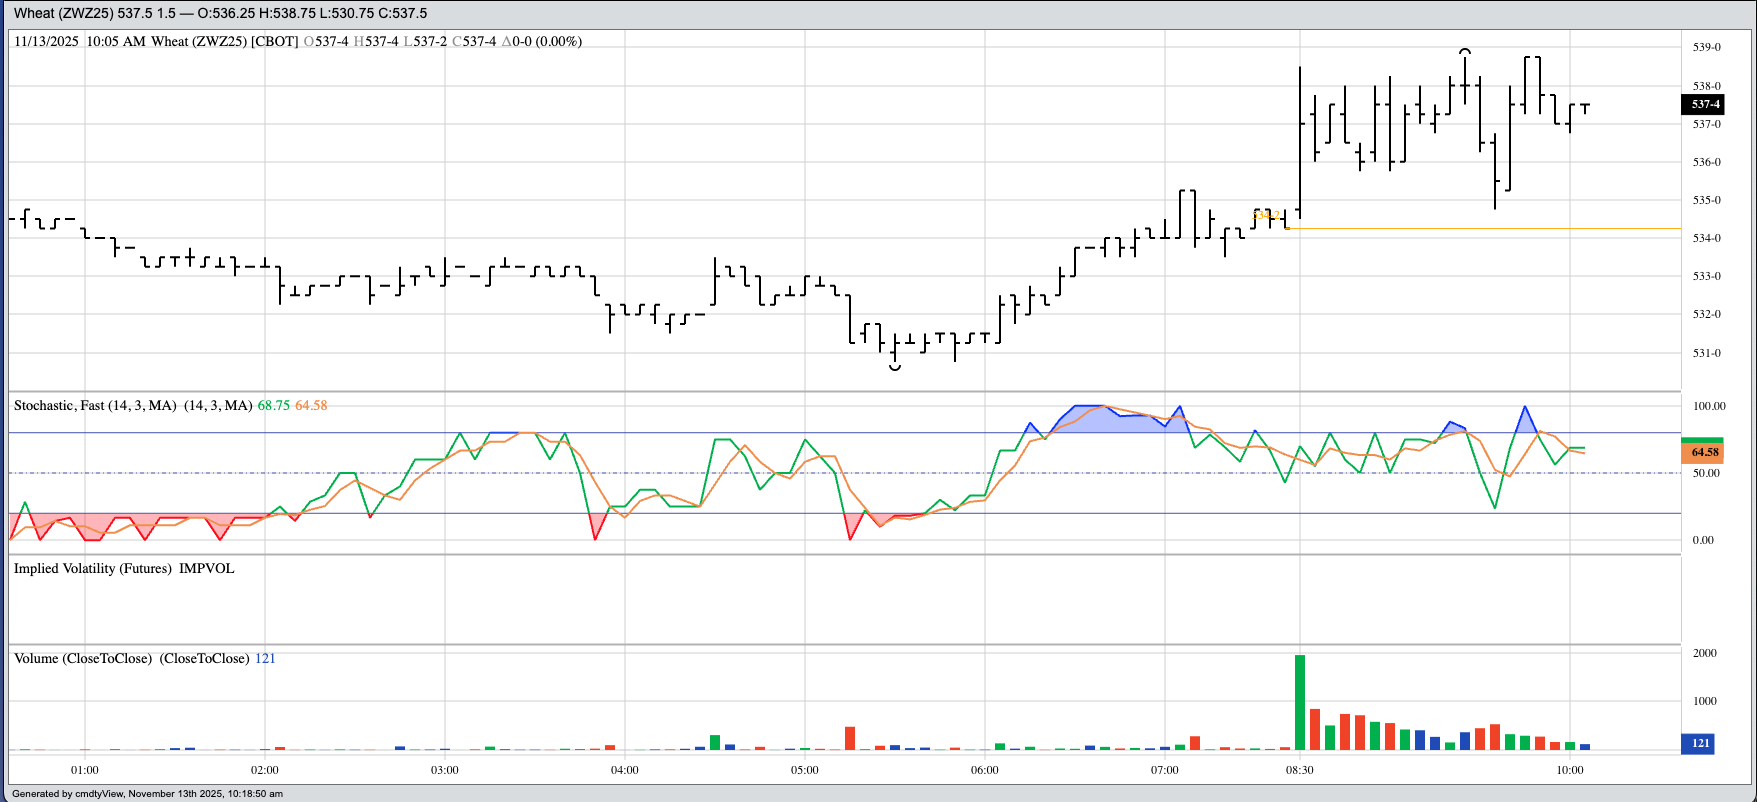
Wheat: The latest weekly export sales and shipment update showed 2025-2026 marketing year export shipments of all U.S. wheat at 345 mb through Thursday, September 25, a point in the marketing year when a 5-year average of 36% of what turns out to be total exports have been shipped. This pace projects total 2025-2026 exports of 958 mb, up 23% from 2024-2025’s reported shipments of 776 mb. The previous update, for the week ending Thursday, September 18, showed the shipment pace running 22% ahead of last year. Outstanding sales were reported at 168 mb, putting total sales at 513 mb (combined outstanding sales and total shipments). This was up 22% from last marketing year’s total sales for the same week of 422 mb versus the previous update’s increase of 24%. In other words, there wasn’t anything extraordinary.
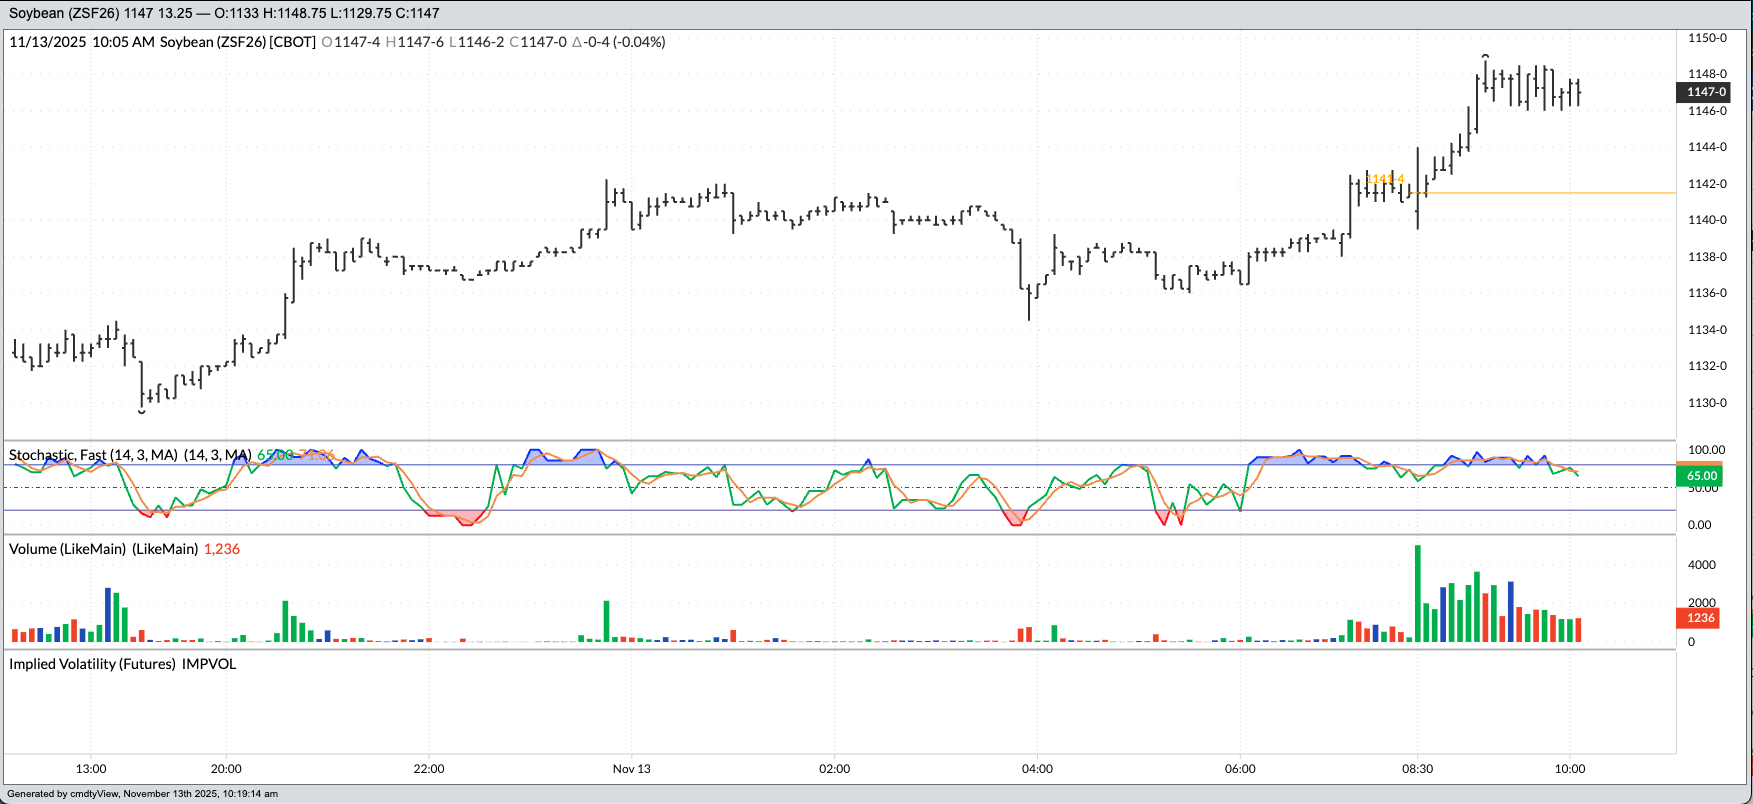
Soybeans: The latest weekly export sales and shipment update showed 2025-2026 marketing year export shipments of U.S. soybeans at 81 mb through Thursday, September 25, a point in the marketing year when a 5-year average of 6% of what turns out to be total exports have been shipped. This pace projects total 2025-2026 exports of 1.35 bb, down 27% from 2024-2025’s reported shipments of 1.841 bb (solid red line). The previous update, for the week ending Thursday, September 18, showed the shipment pace running 63% ahead of last year. Outstanding sales were reported at 356 mb, putting total sales at 437 mb (combined outstanding sales and total shipments). This was down 37% from last marketing year’s total sales of 694 mb for the same week, unchanged from the previous update. Again, the bottom line shouldn’t have been overly surprising.
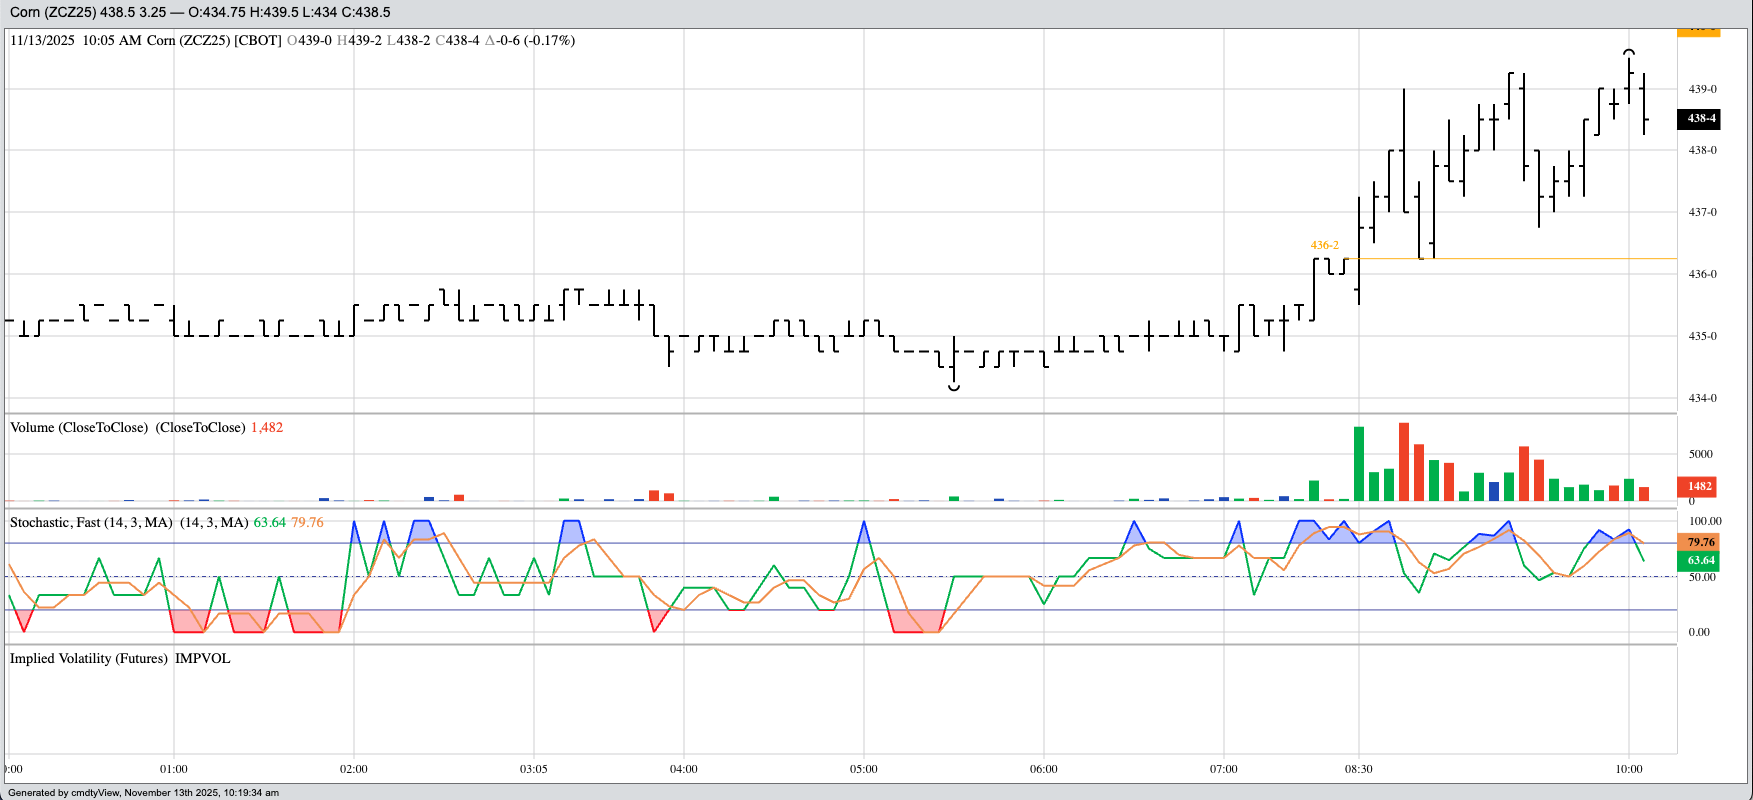
Corn: The latest weekly export sales and shipment update showed 2025-2026 marketing year export shipments of US corn at 196 mb through Thursday, September 25, a point in the marketing year when a 5-year average of 4% of what turns out to be total exports have been shipped. This pace projects total 2025-2026 exports of 4.9 bb, up 129% from 2024-2025’s reported shipments of 2.72 bb. The previous update, for the week ending Thursday, September 18, showed the shipment pace running 118% ahead of last year. Outstanding sales were reported at 873 mb, putting total sales at 1.069 bb (combined outstanding sales and total shipments). This was up 65% from last marketing year’s total sales of 647 mb for the same week as compared to the previous update of a 75% increase. The corn export numbers were strong, no doubt, but they were again for the end of September.
The sector is expected to get more interesting Friday as USDA is set to release its November 2025 World Agricultural Supply and Demand Estimates (WASDE) to the world. I’m expecting the BRACE Industry – Brokers/Reporters/Analysts/Commentator/Economists who are likely wetting themselves in excitement waiting for new imaginary numbers – to break out in a rousing round of Kumbaya.
As you can tell, I find a great deal of humor in all this. It reminds me of a man who drowns in 6 inches of water because he isn’t smart enough to simply stand up. The fact real supply and demand is in front of us every hour of every day of every week or every month – in the form of cash prices, basis, futures spreads, and forward curves – is too difficult for the masses to wrap their head around.
Which brings me to my final point, a little something I like to call the Marx Maxim. To paraphrase Karl Marx’s thought on religion, and given government numbers are held sacred by so many, “Government numbers are the opiate of the masses.”
On the date of publication, Darin Newsom did not have (either directly or indirectly) positions in any of the securities mentioned in this article. All information and data in this article is solely for informational purposes. For more information please view the Barchart Disclosure Policy here.
More news from Barchart


